Data is a vital asset for any organisation. Data can be raw, unstructured and unorganised. To extract meaningful insights and information from data we need to analyse it. There are different types of analytics.
Data Analytics is the process of cleaning, reviewing, purifying, modelling, transforming
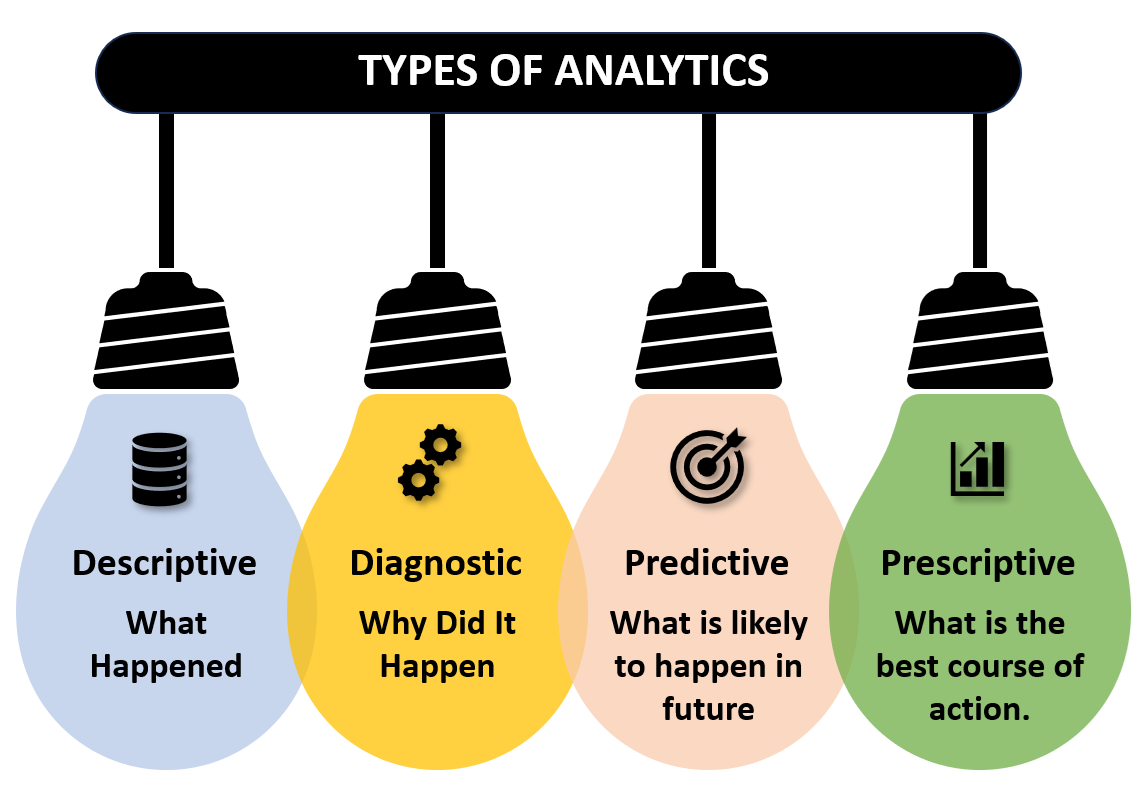
Descriptive analysis
This analysis looks at what happened in the past. It does not explain why it happened , or any cause effect relation or any future analysis. It allows you to condense large information into smaller bits. It helps us to understand information on an aggregate level. It is used to summarize and describe the data’s main features. Descriptive analysis helps an organisation learn from past behaviour and use this data for future analysis.
E.g :
We have a software. We may use descriptive analysis to summarize and describe data collected from people who use the software.
Diagnostic analysis
This analysis looks at why the data happened? It helps to identify and respond to anomalies in our data. It is a root cause analysis where we find out the reasons for the occurrence of a particular event. We can identify patterns, isolate patterns of data. This analysis is a deep dive into data and find out why the data metrics a particular way.
E.g :
If we have a 30% increase in our sales in a particular region. We need to find out why this happened. We can further breakdown sales into product categories, sub categories to do a further deep dive. We can identify where sales increase .
Predictive analysis
This analysis looks at what is likely to happen in future?
We look at past data patterns , we use predictive models to estimate the likelihood of an event. Statistical modelling, algorithm, machine learning are used for predictive modelling. Relation between set of variables is used to make predictions. Data gathered during descriptive and diagnostic phase is used for prescriptive analysis.
E.g :
- We can use relation between promotional schemes and sales to predict if a particular scheme will lead to increase in sales.
- We can predict on a festival weekend what will the orders placed in a restaurant.
- We can analyse our competitors behaviour to predict future behaviour
Prescriptive analysis
This analysis looks at what action should be taken?
We can use machine learning, statistical modelling and algorithm to make decision patterns that a company might take. We can use a combination of conditions, methods to measure the impact of a decision. We can find out the best route of decision.
E.g
What should be course of action to increase sales basis past pattern of data.