For all the methods the data needs to be arranged in ascending or descending order.


For all the methods the data needs to be arranged in ascending or descending order.


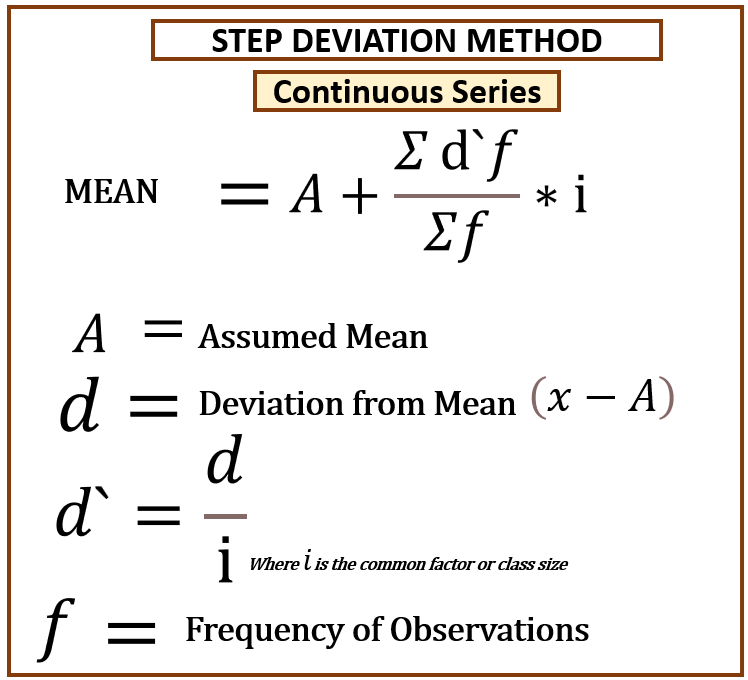


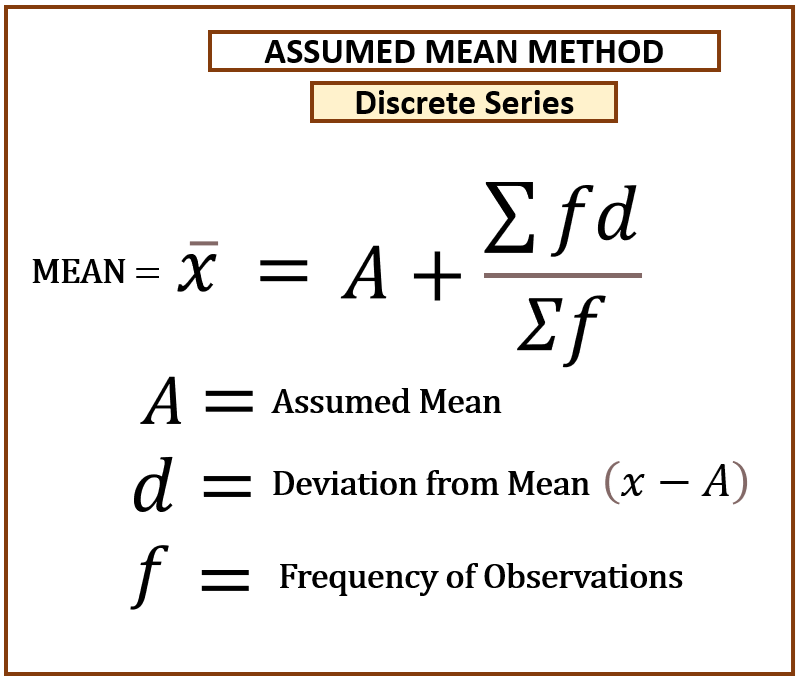


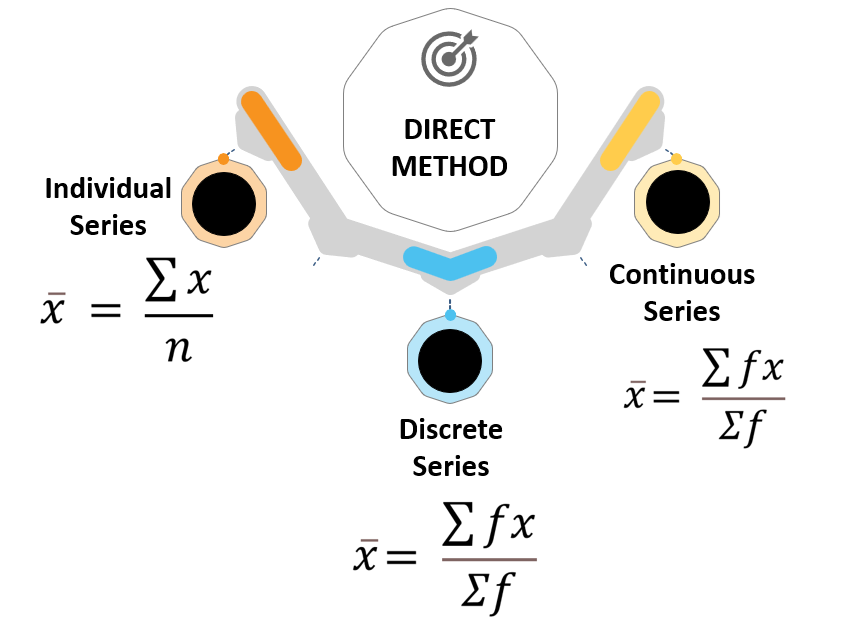
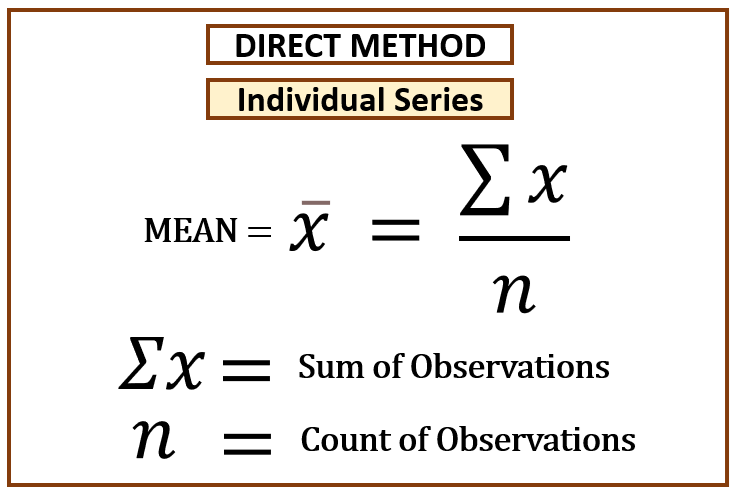
MEAN
The mean is the average/ middle value of a set of observations. There are three methods of calculating mean.
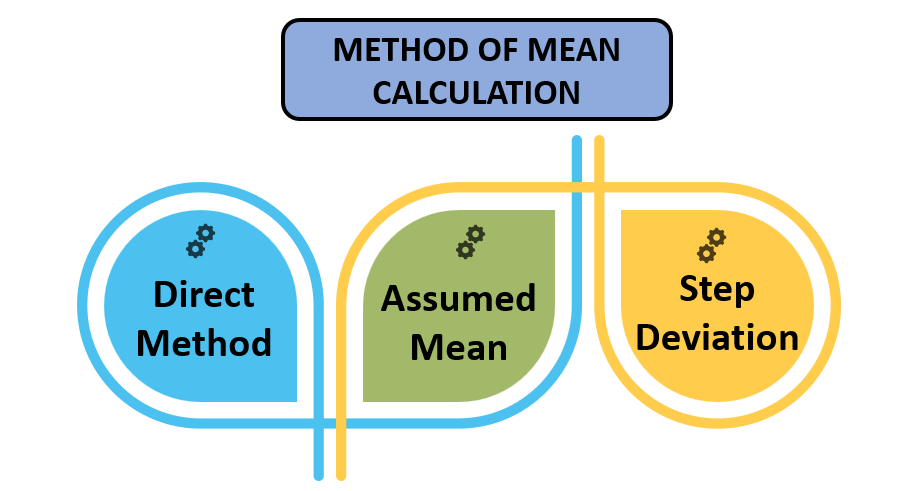
Each method has further three methods for each of the series.
Individual Series, Discrete Series and Continuous Series are all calculated differently under each of these methods.
CENTRAL TENDENCY
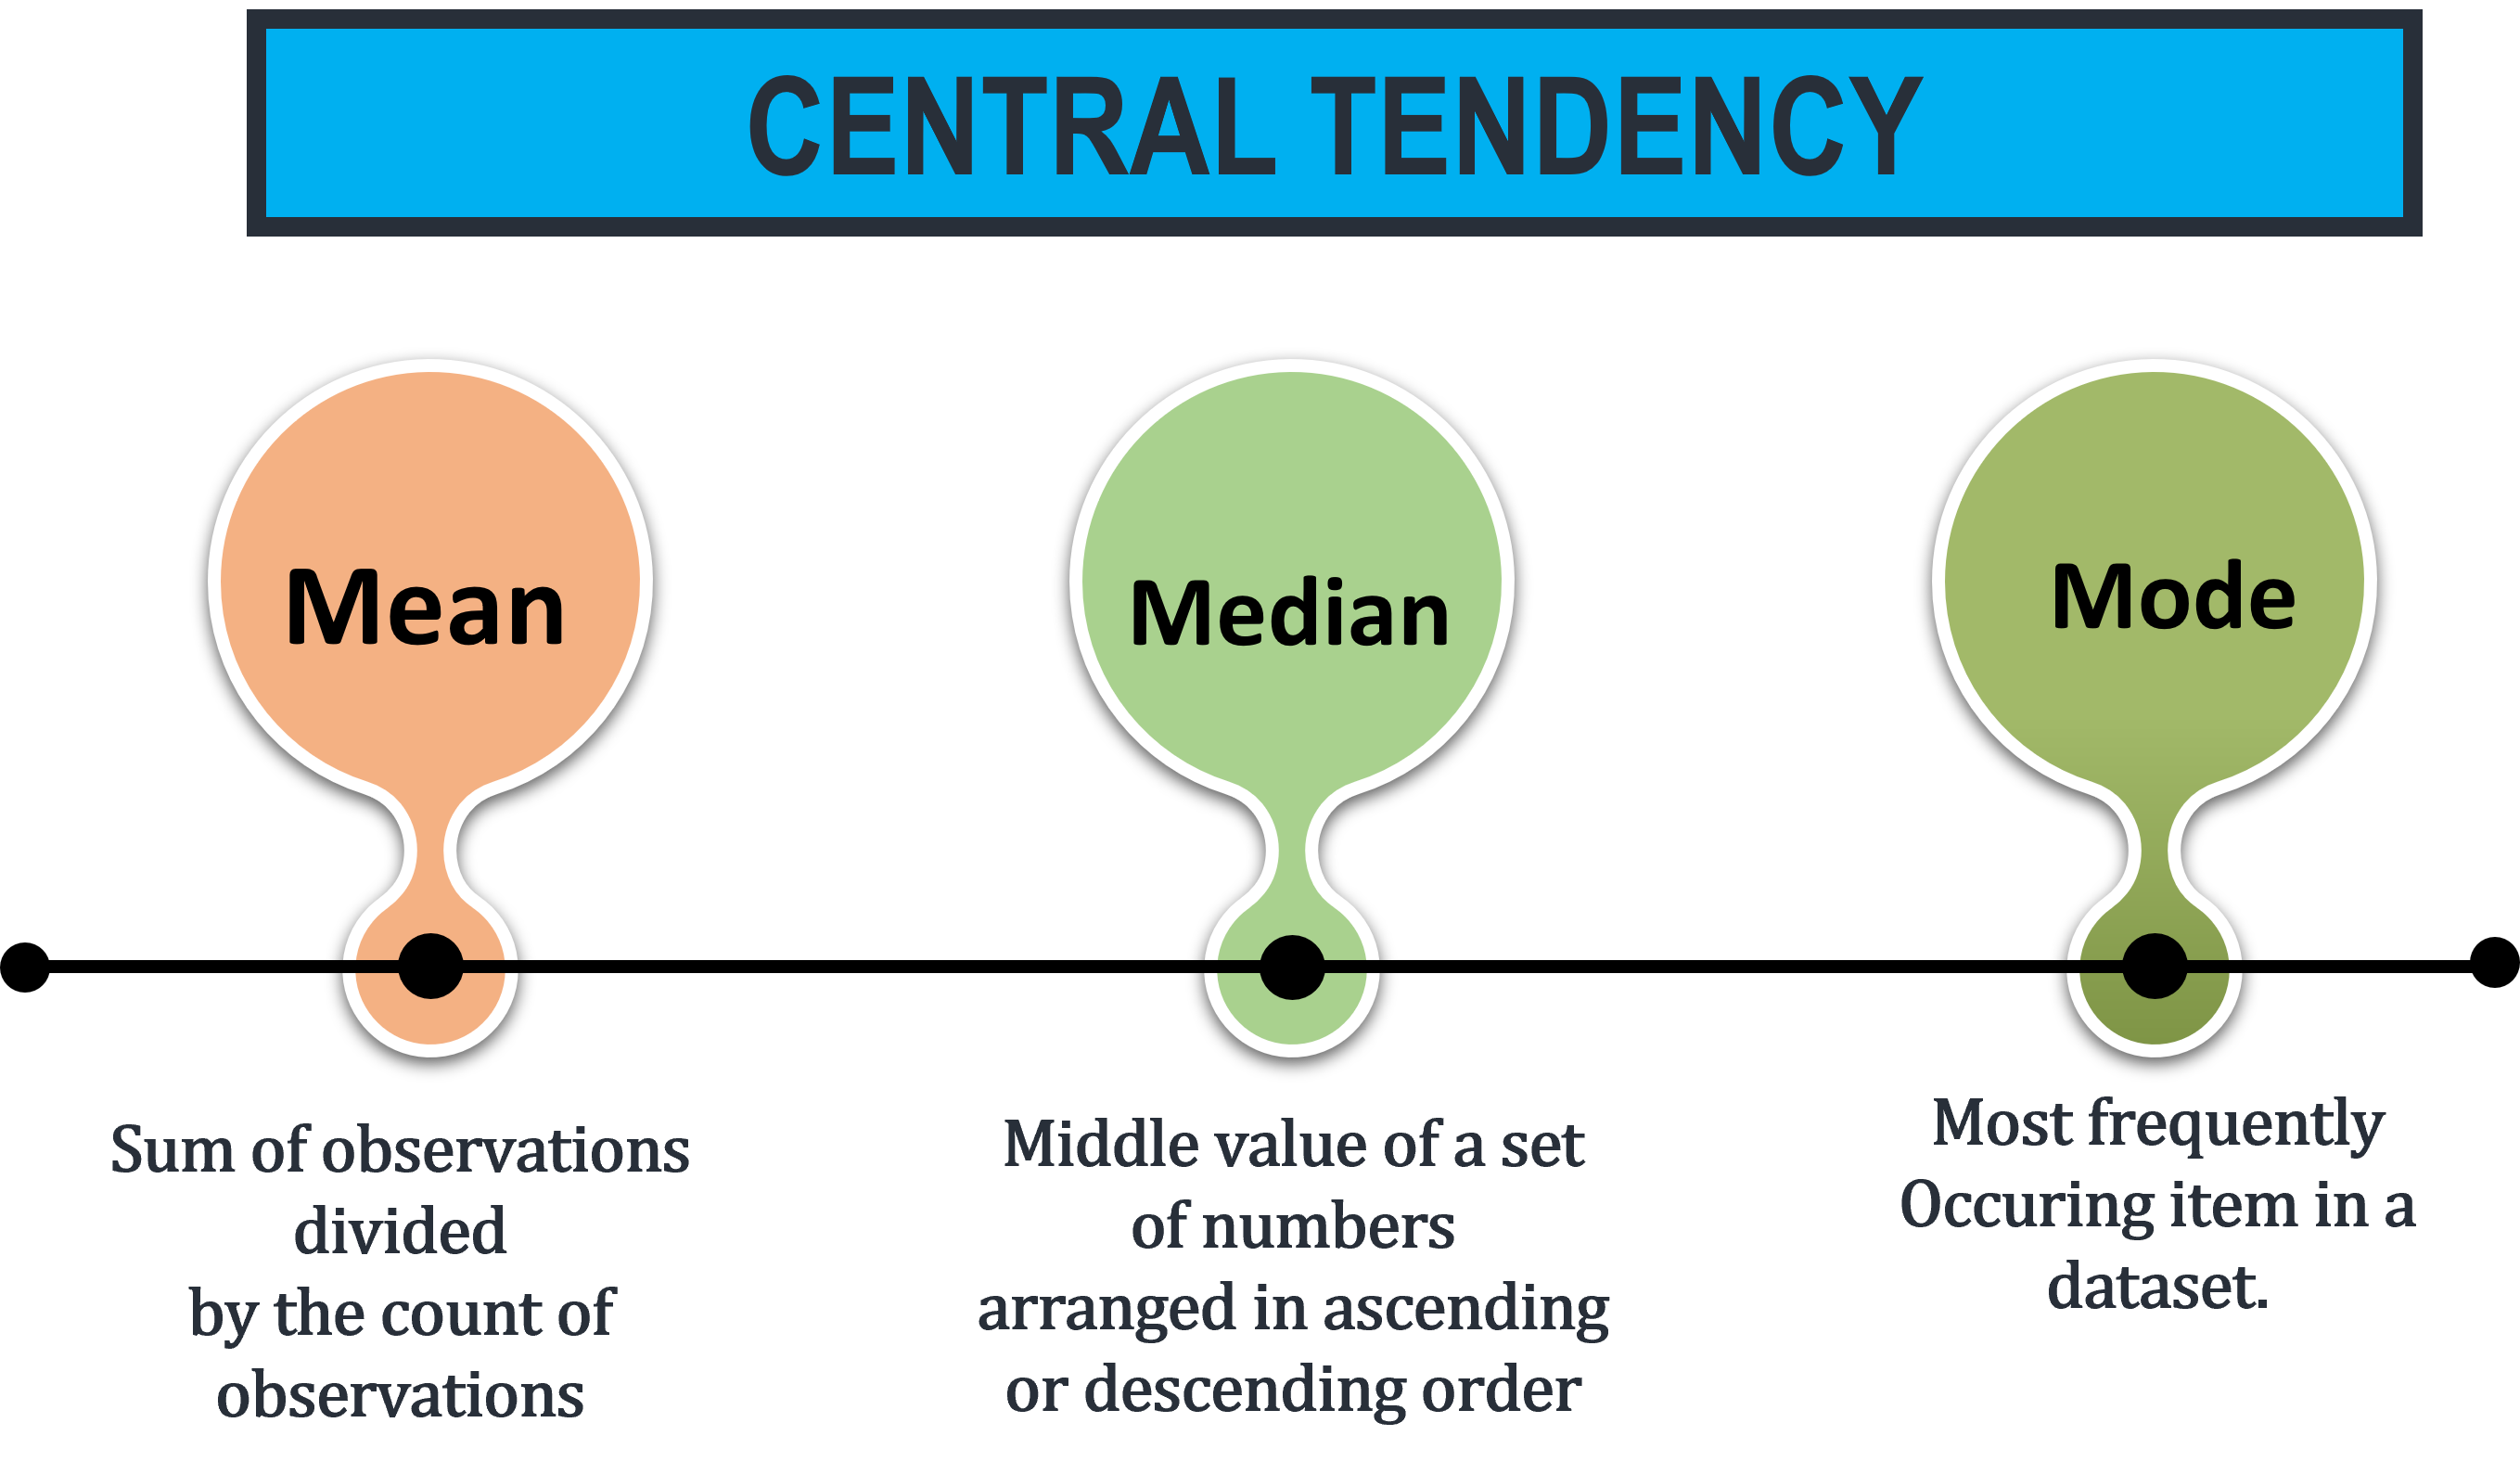
A measure of central tendency represents mid-value or the most occurring value a large collection of numerical data. It is of significance because it depicts the nature or characteristics of the entire data.

The mean is the sum of observations divided by the count of observations.
Example: Consider the dataset: 34, 76, 98, 80, 15, 44, 54
Mean = 401/7
Mean = 57.3

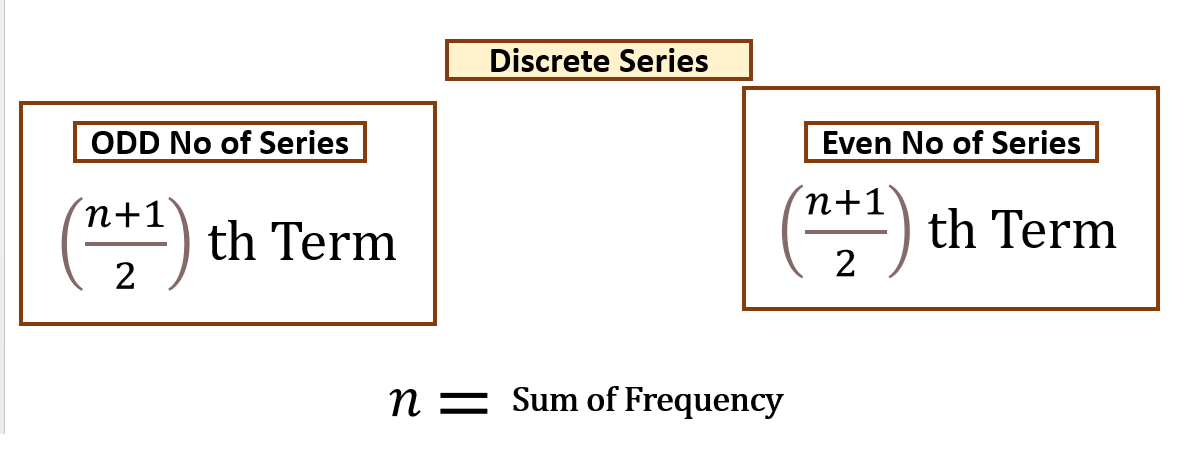
The median is the middle value of a set of numbers arranged in ascending or descending order.
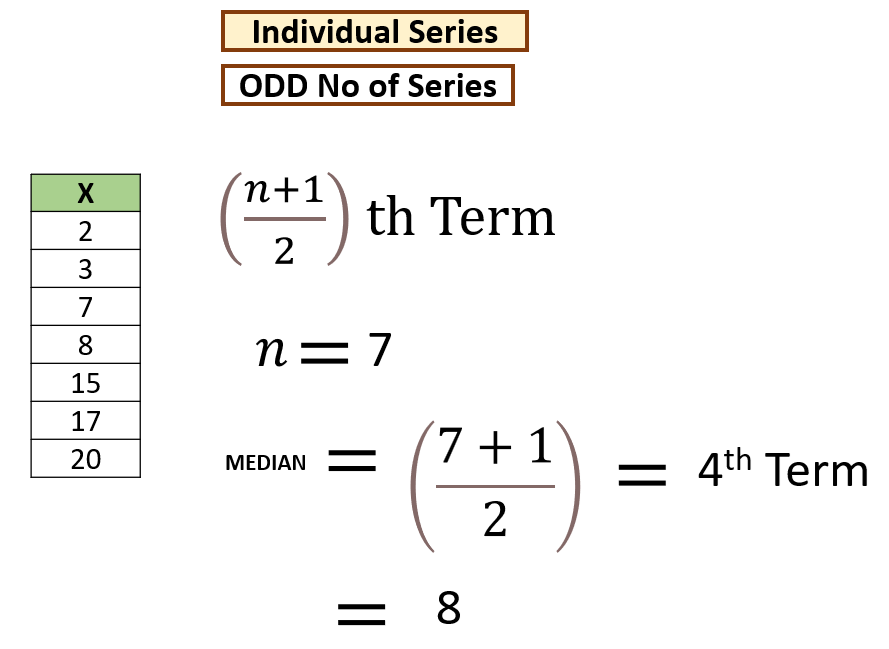
ODD NUMBER OF DATA POINTS
Example: Consider the dataset: 25, 63, 95, 85, 12, 32, 41
Solution
In the above dataset, there are 7 data points, so firstly, arrange the data points in ascending order (lowest to greatest), i.e.,
12, 25, 32, 41, 63, 85, 95
Median = ((n+1)/2)th
Median = ((7+1)/2)th
Median = 4th value
Hence, the median is 41.
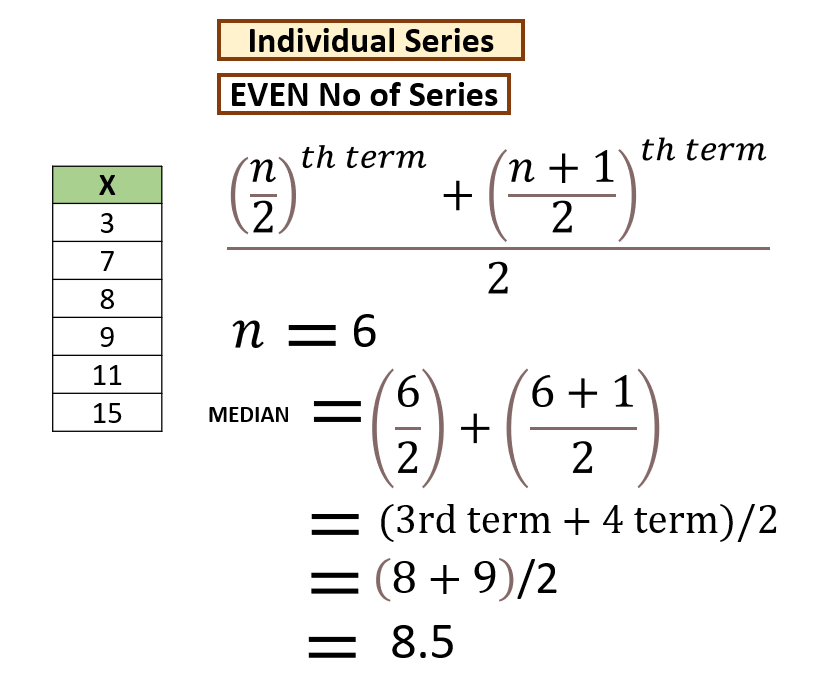
EVEN NUMBER OF DATA POINTS
Example: Consider the dataset: 27, 60, 98, 88, 18, 78
In the above dataset, there are 6 data points, so firstly, arrange the data points in ascending order (lowest to greatest), i.e.,
18, 27, 60, 78, 88, 98
Median = [(n/2)th term + ((n/2) + 1)th term] / 2
Median = [(6/2)th term + ((6/2) + 1)th term] / 2
Median = [(3th term + 4th term] / 2
Median = 98+88/2 = 93
Hence, the median is 93.

The mode is the most frequently occurring value in a dataset.
Example: Consider the dataset: 27, 60, 88, 88, 88, 78
88 is the most frequently occurring item.
Mode is 88
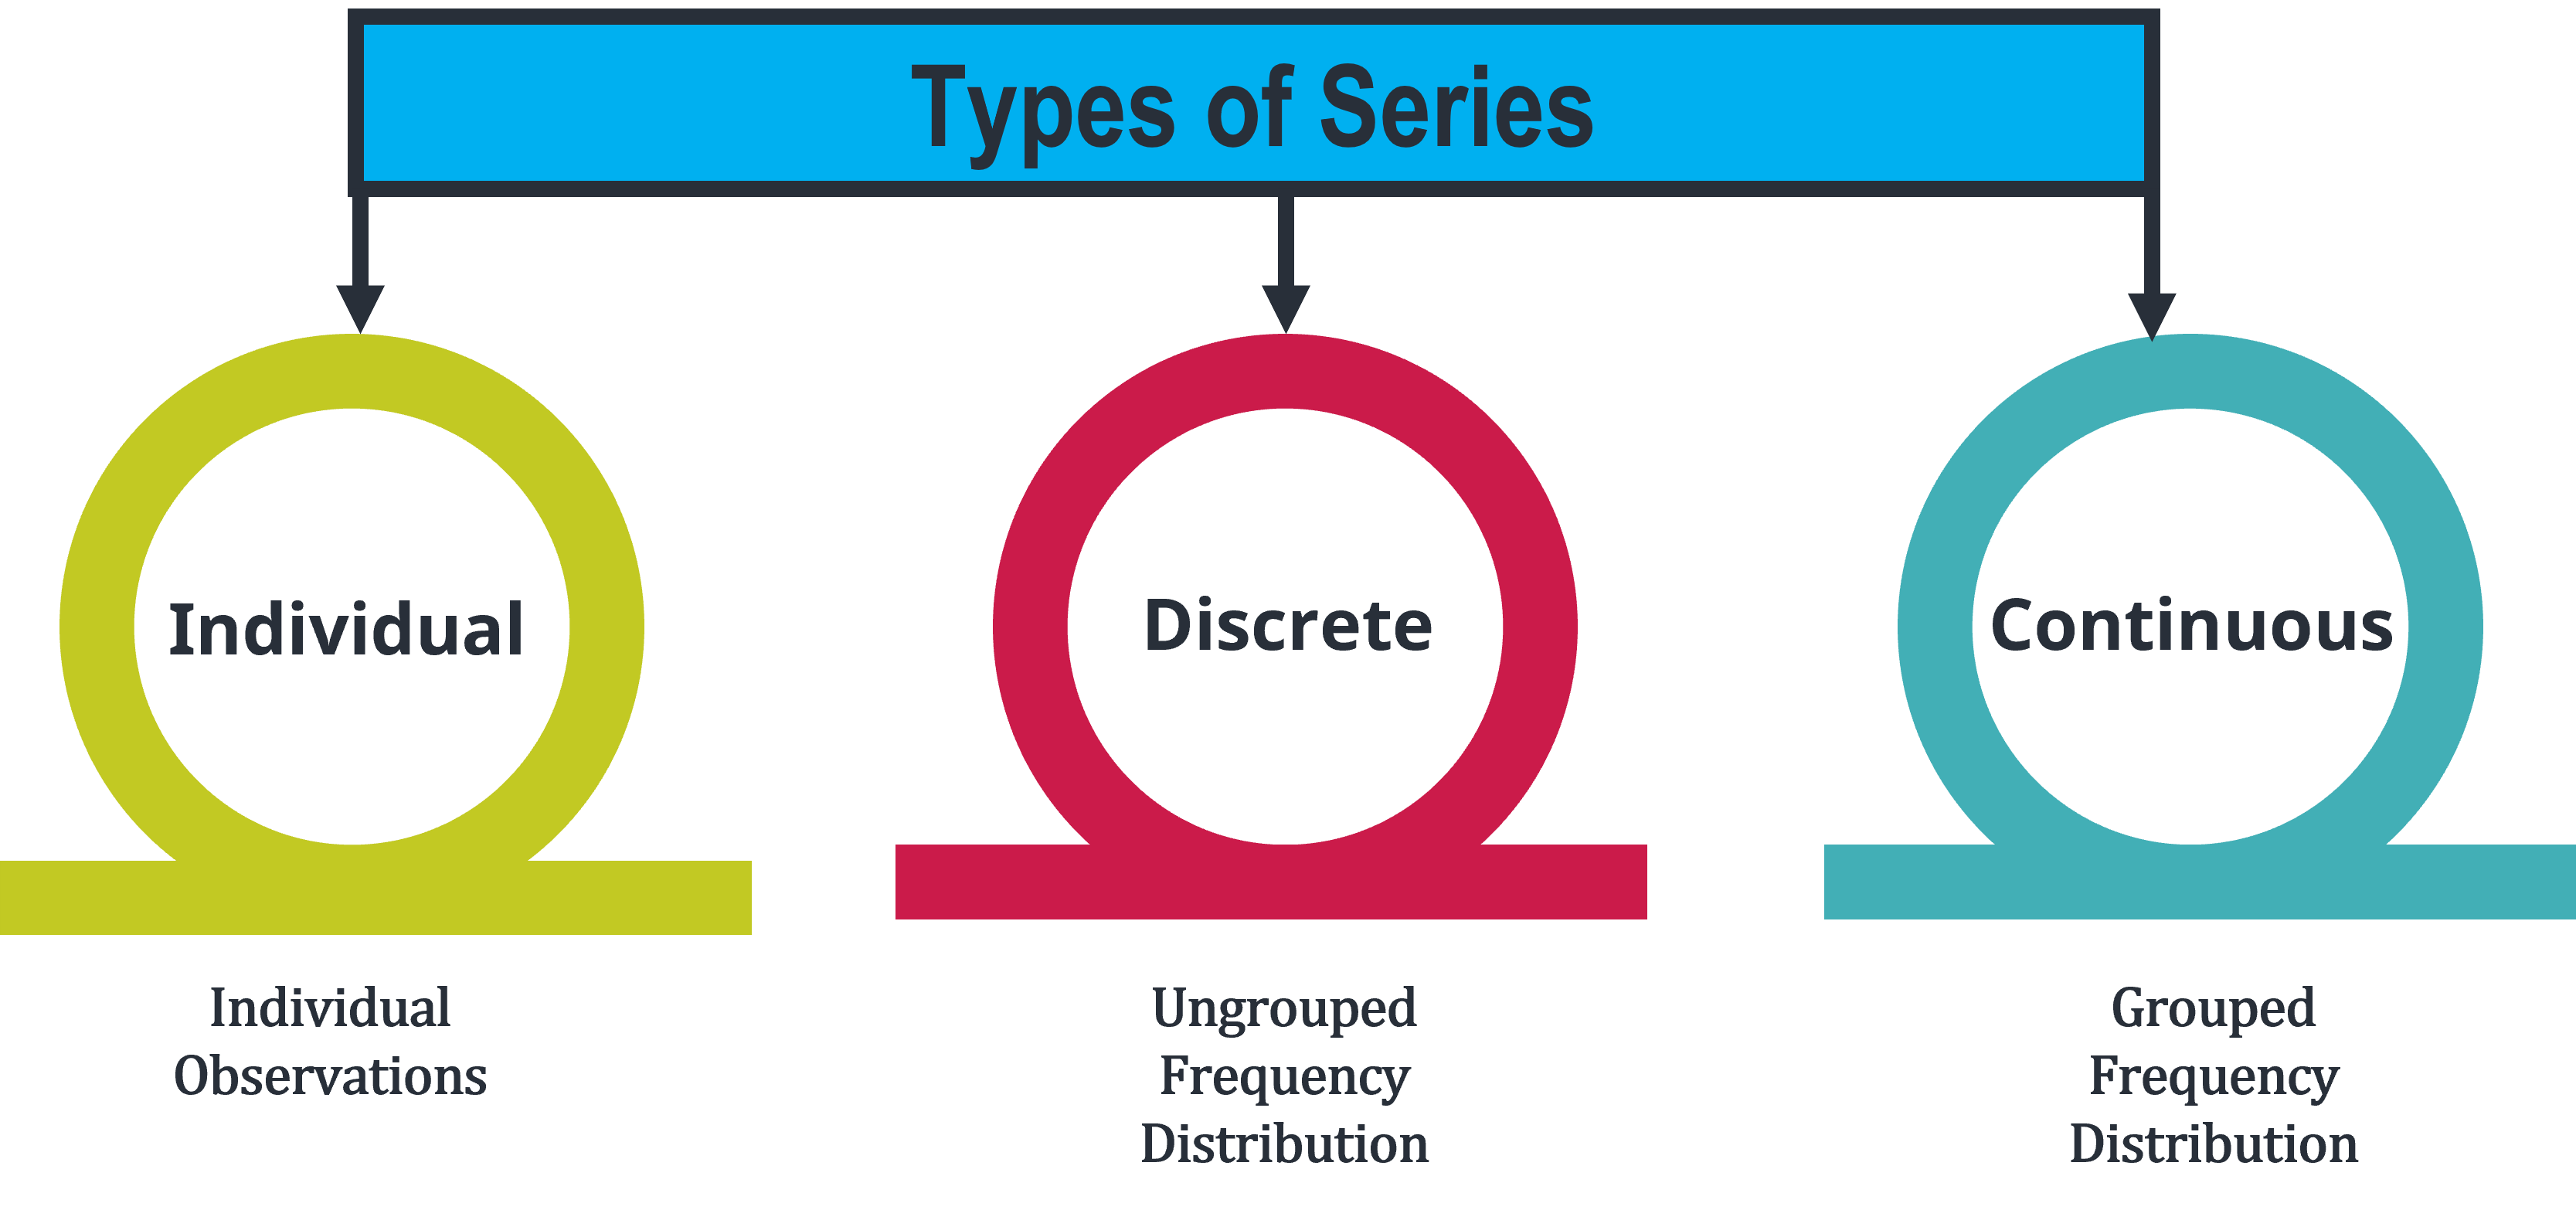
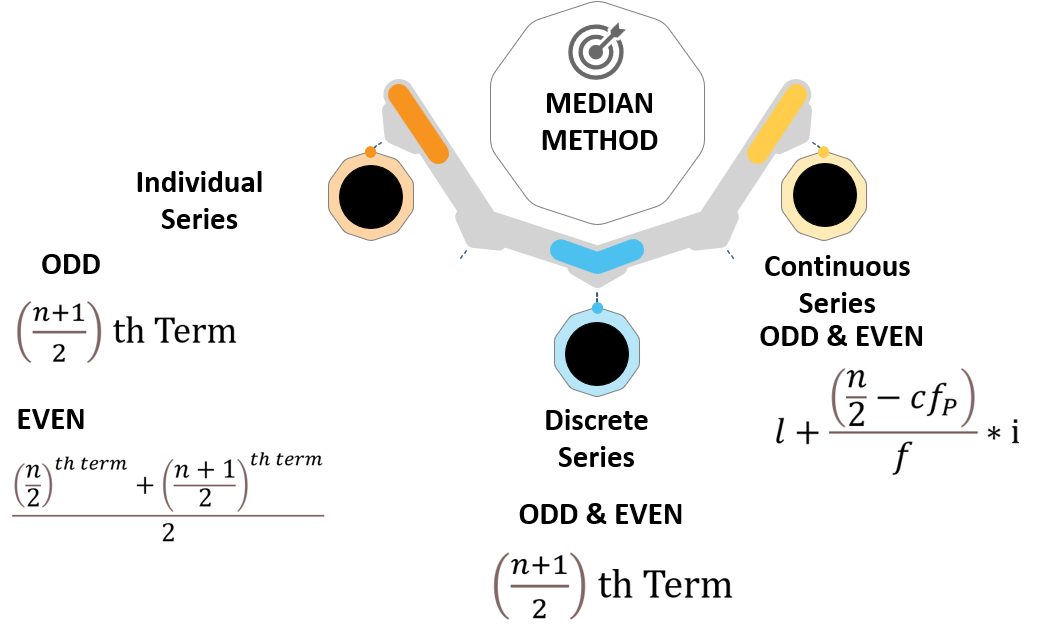
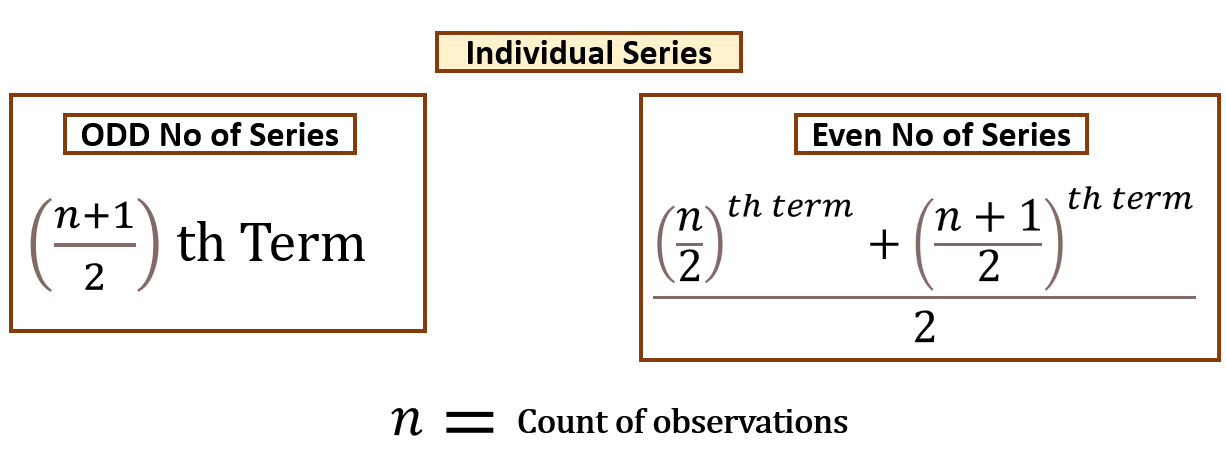
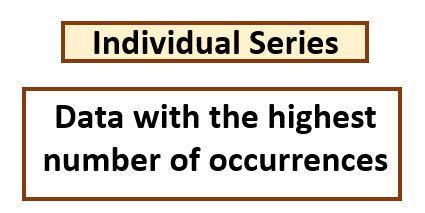
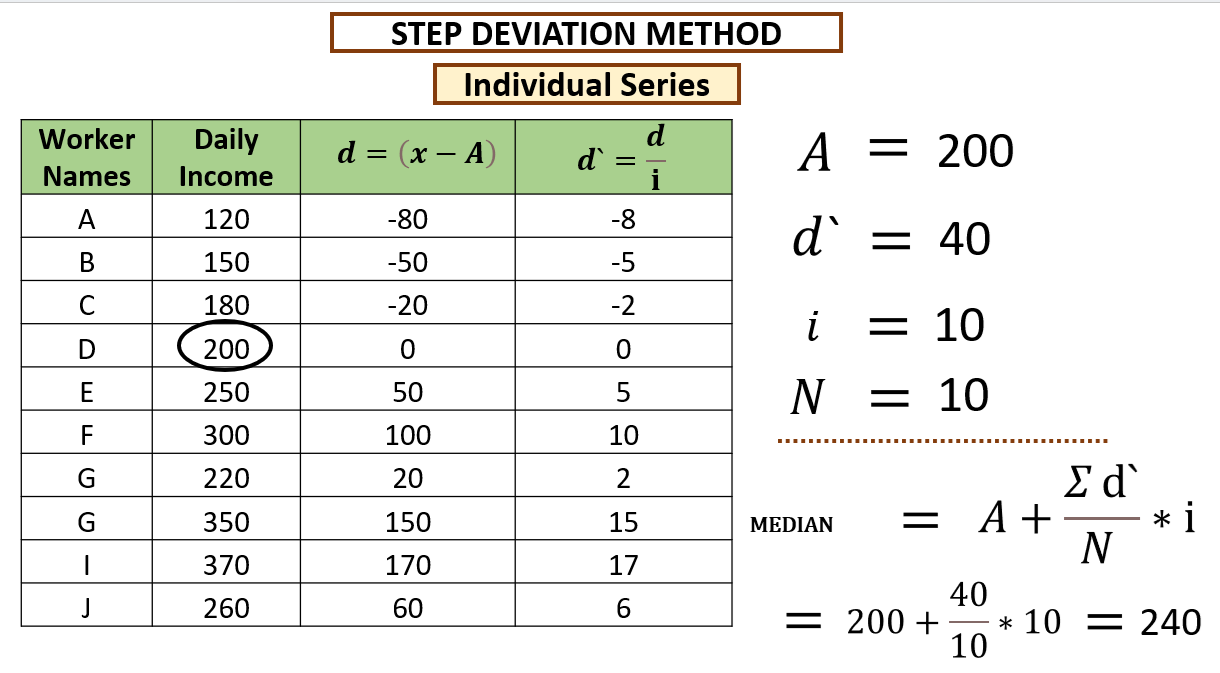
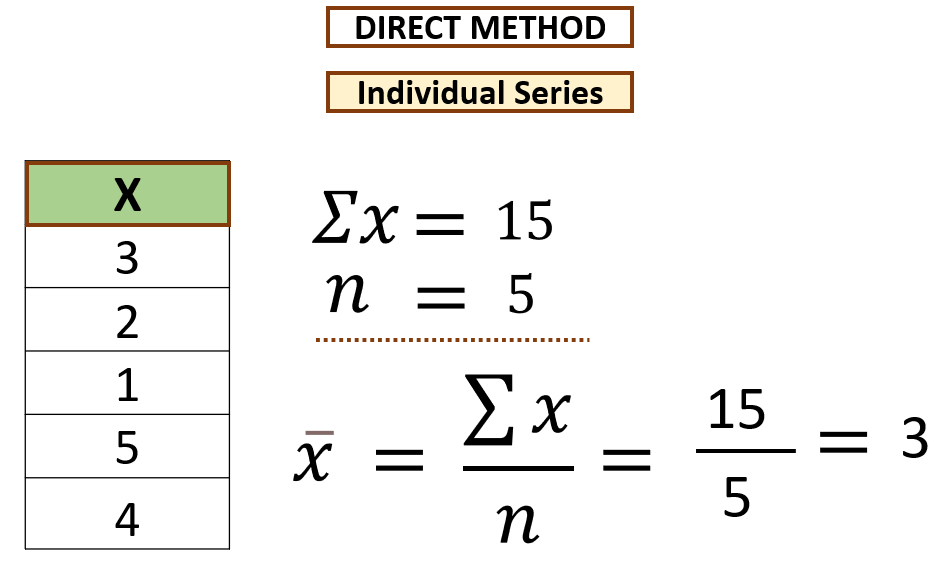
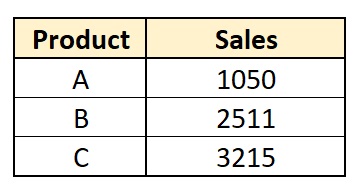
INDIVIDUAL SERIES
In this series, each type of value is shown separately. Groups or Classes are not formed. Individual Series has only one column and that is the observations. There is no column for frequency. All the observations have a frequency of 1.
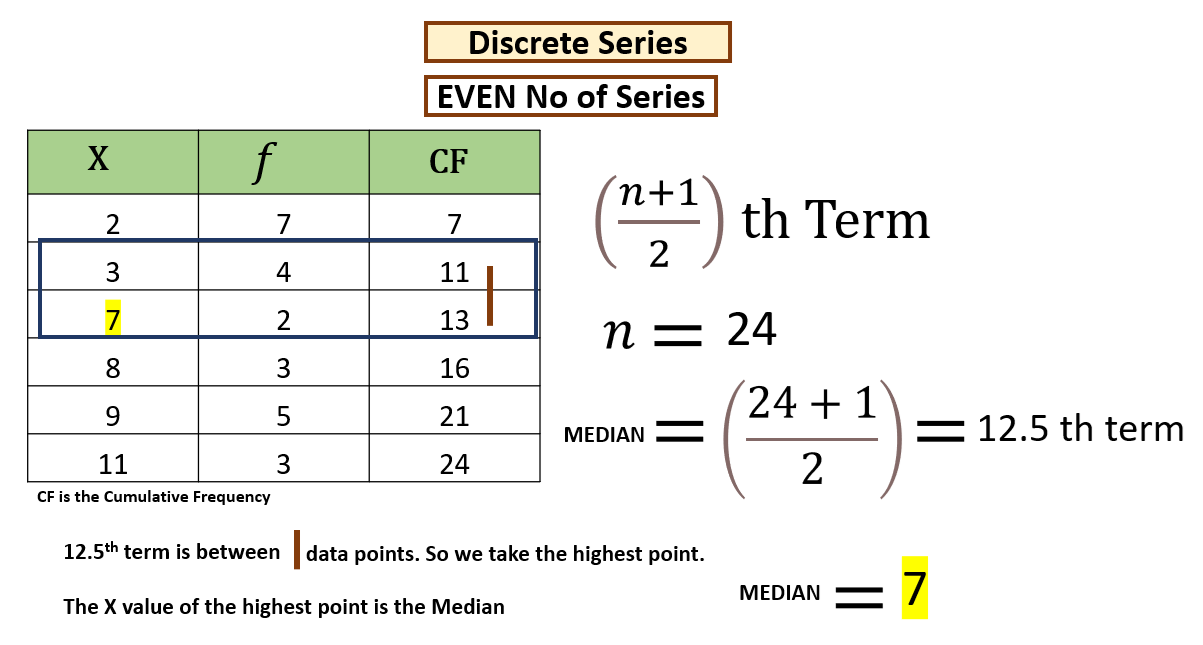
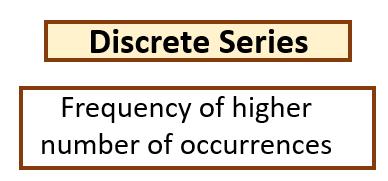
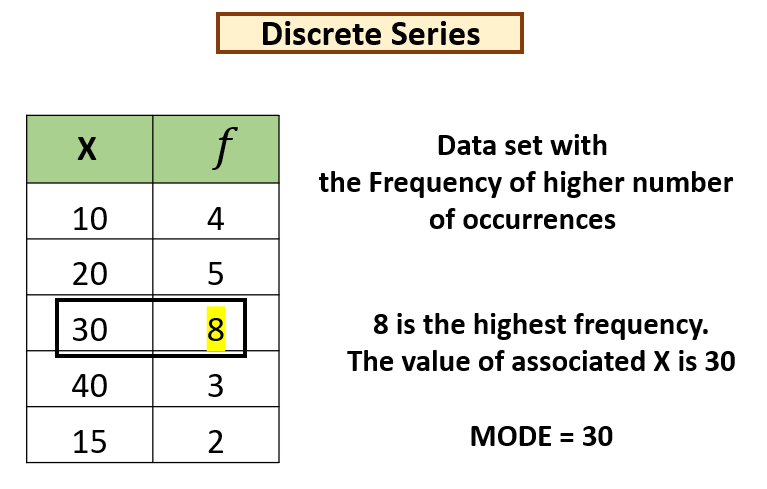
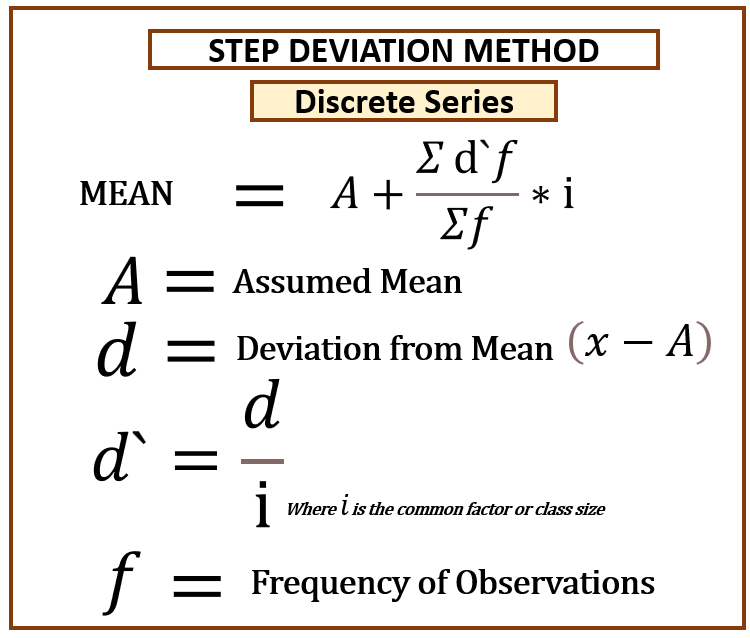
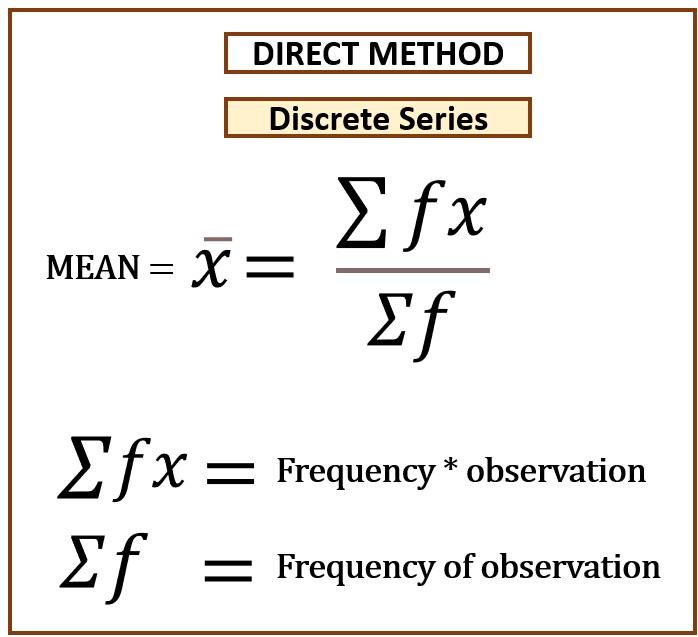
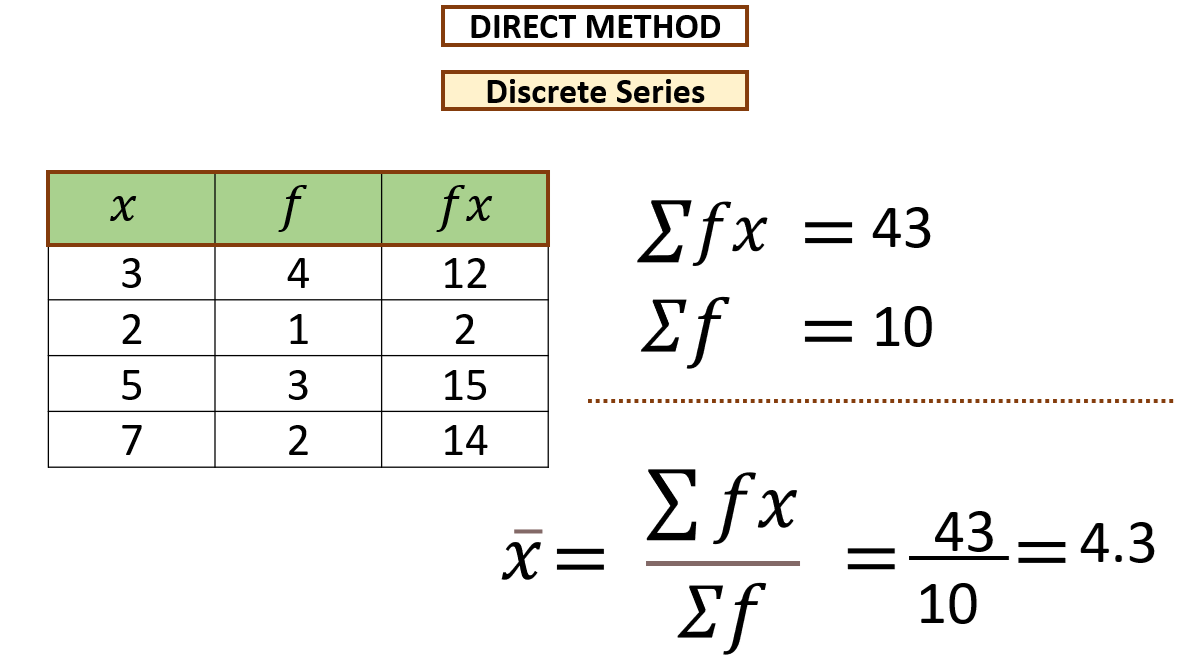
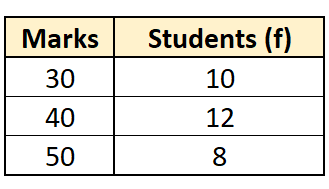
DISCRETE SERIES
It is also called Ungrouped Frequency Distribution. Discrete Series are shown on the basis of definite/discrete values. There is more than one frequency for each item. Different values of the variables are shown with their respective frequencies. A discrete variable does not take a fractional value but takes just definite integral values.
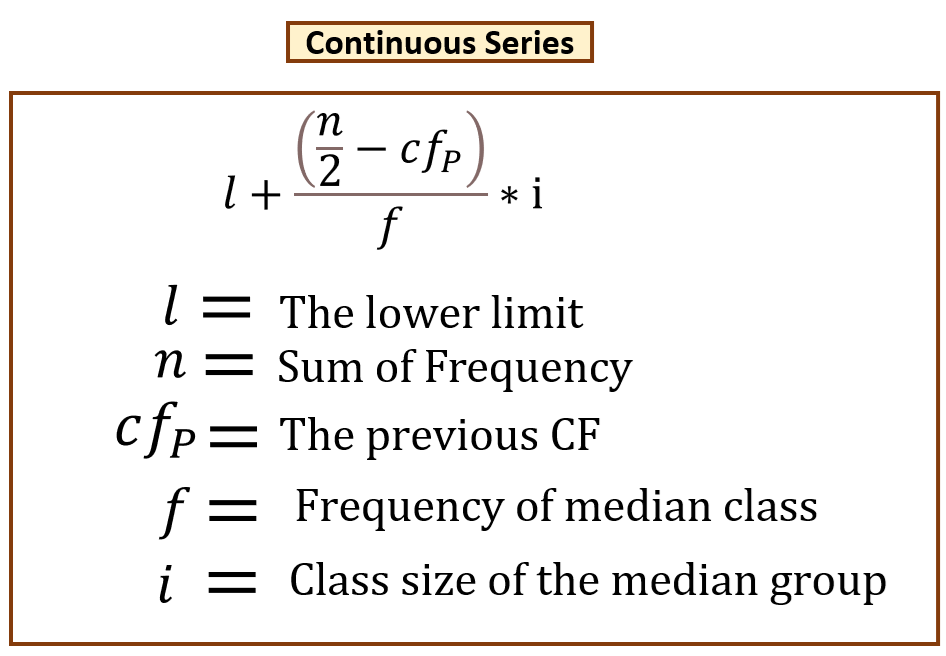
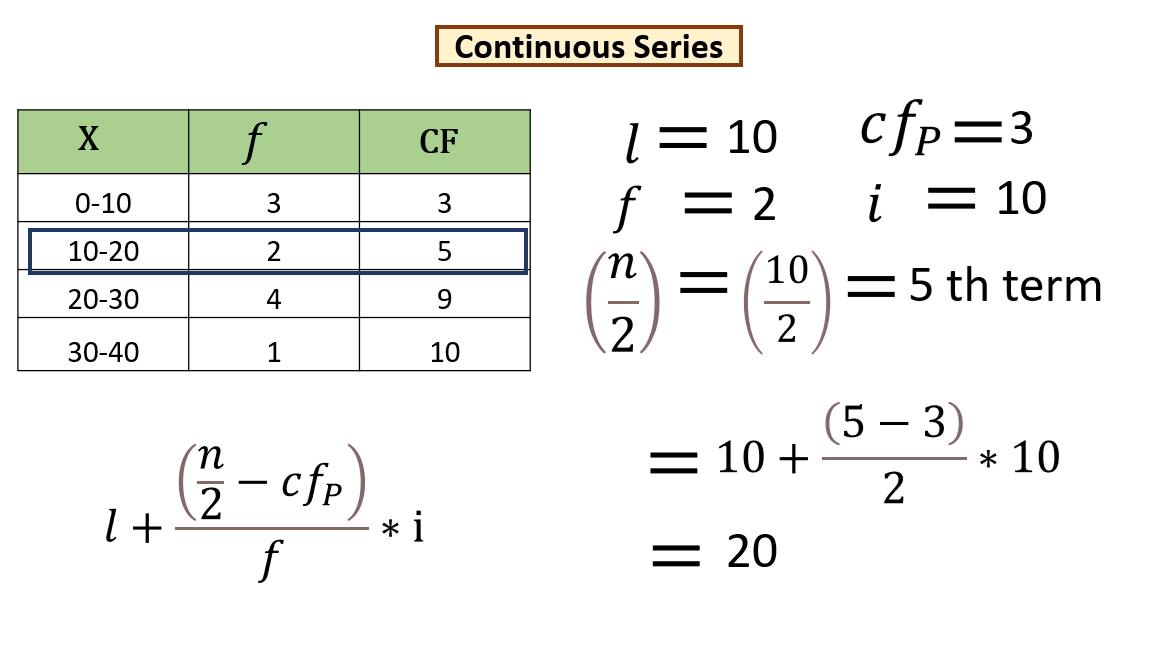
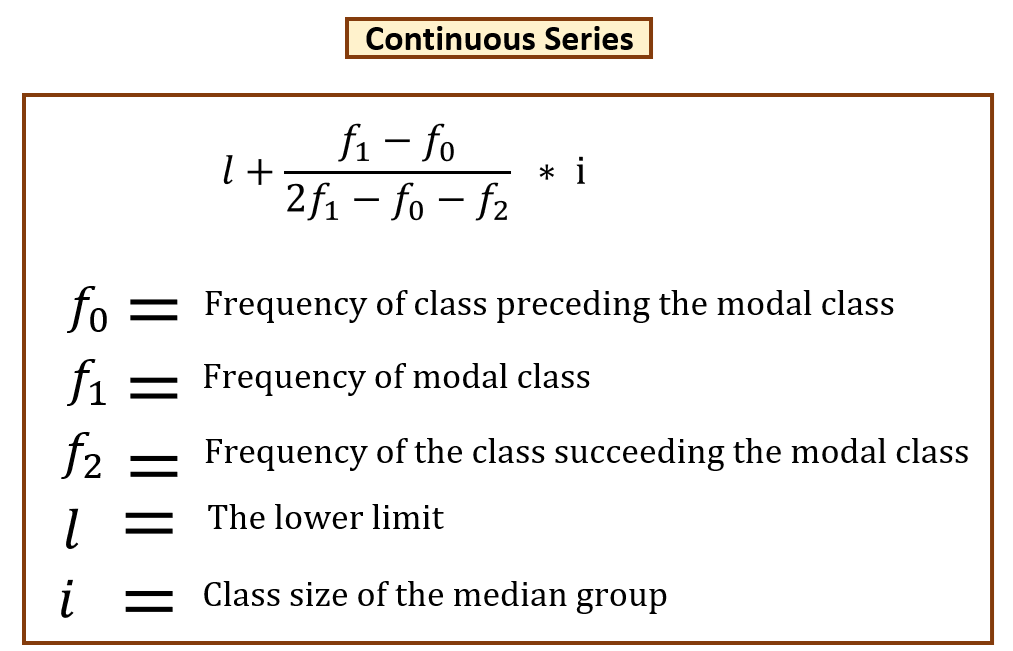
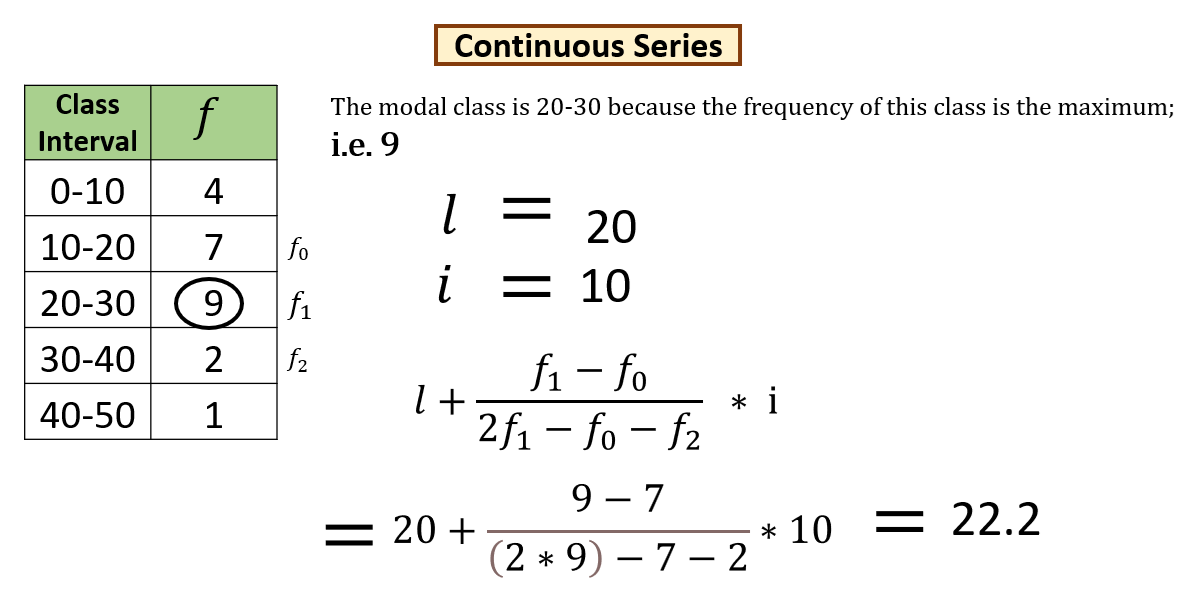
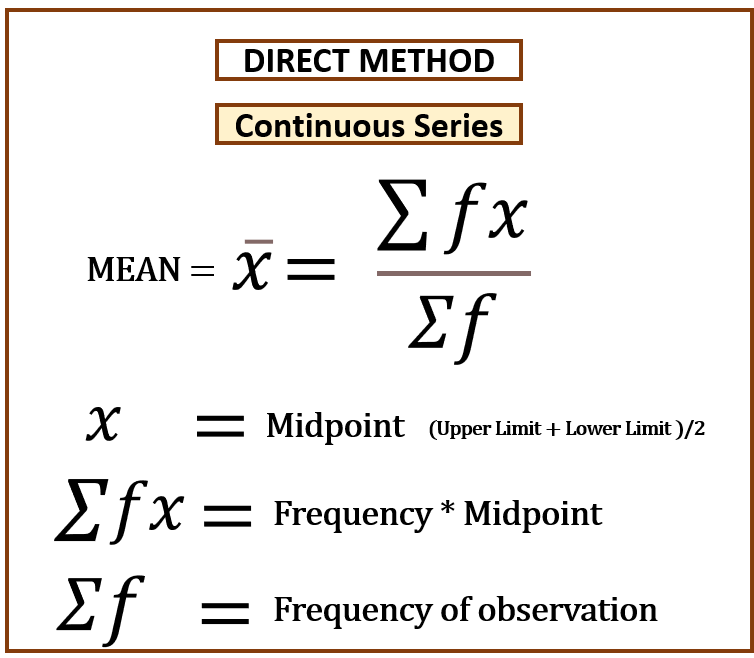
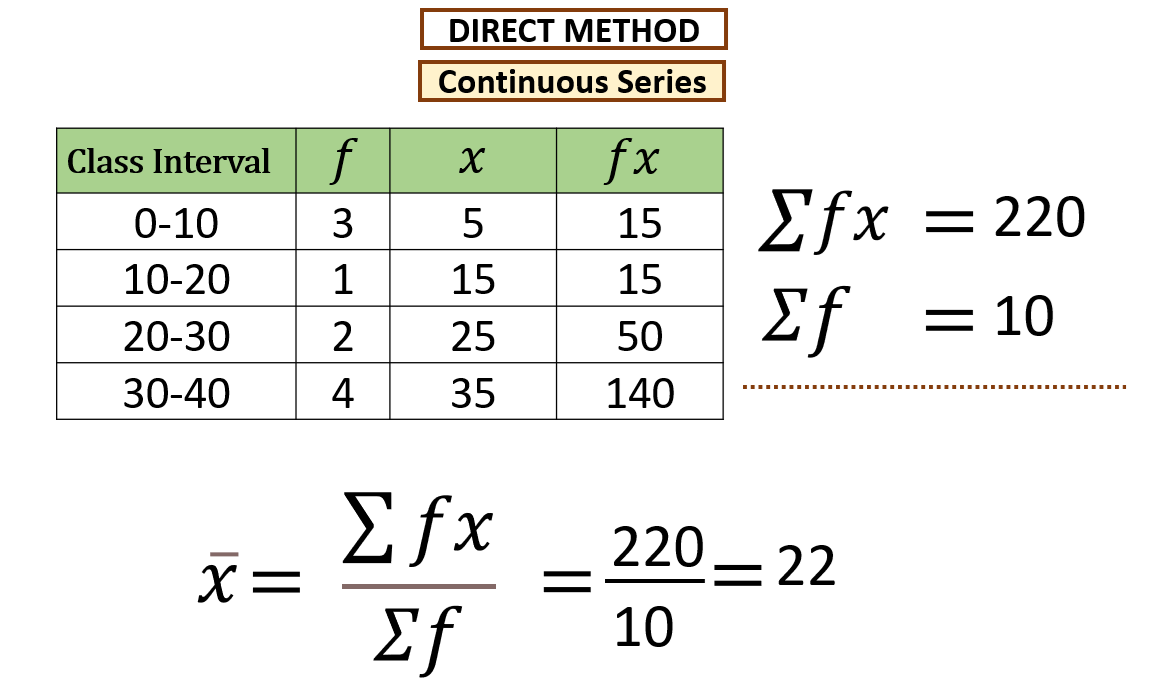
CONTINUOUS SERIES
It is also called Grouped Frequency Distribution. A continuous series is one which the different values of the variables are stated in a continuous manner along with their respective frequencies. The classes are formed from beginning to end, without any breaks. Such series can be stated either in the form Inclusive or Exclusive.

Inclusive Series
In this type of series, the upper limit of the class interval is included in the class itself. The class does not overlap.

Exclusive Series
In this type of series, the upper limit of the class interval is excluded from the class itself and is included in the next class.