For all the methods the data needs to be arranged in ascending or descending order.


For all the methods the data needs to be arranged in ascending or descending order.
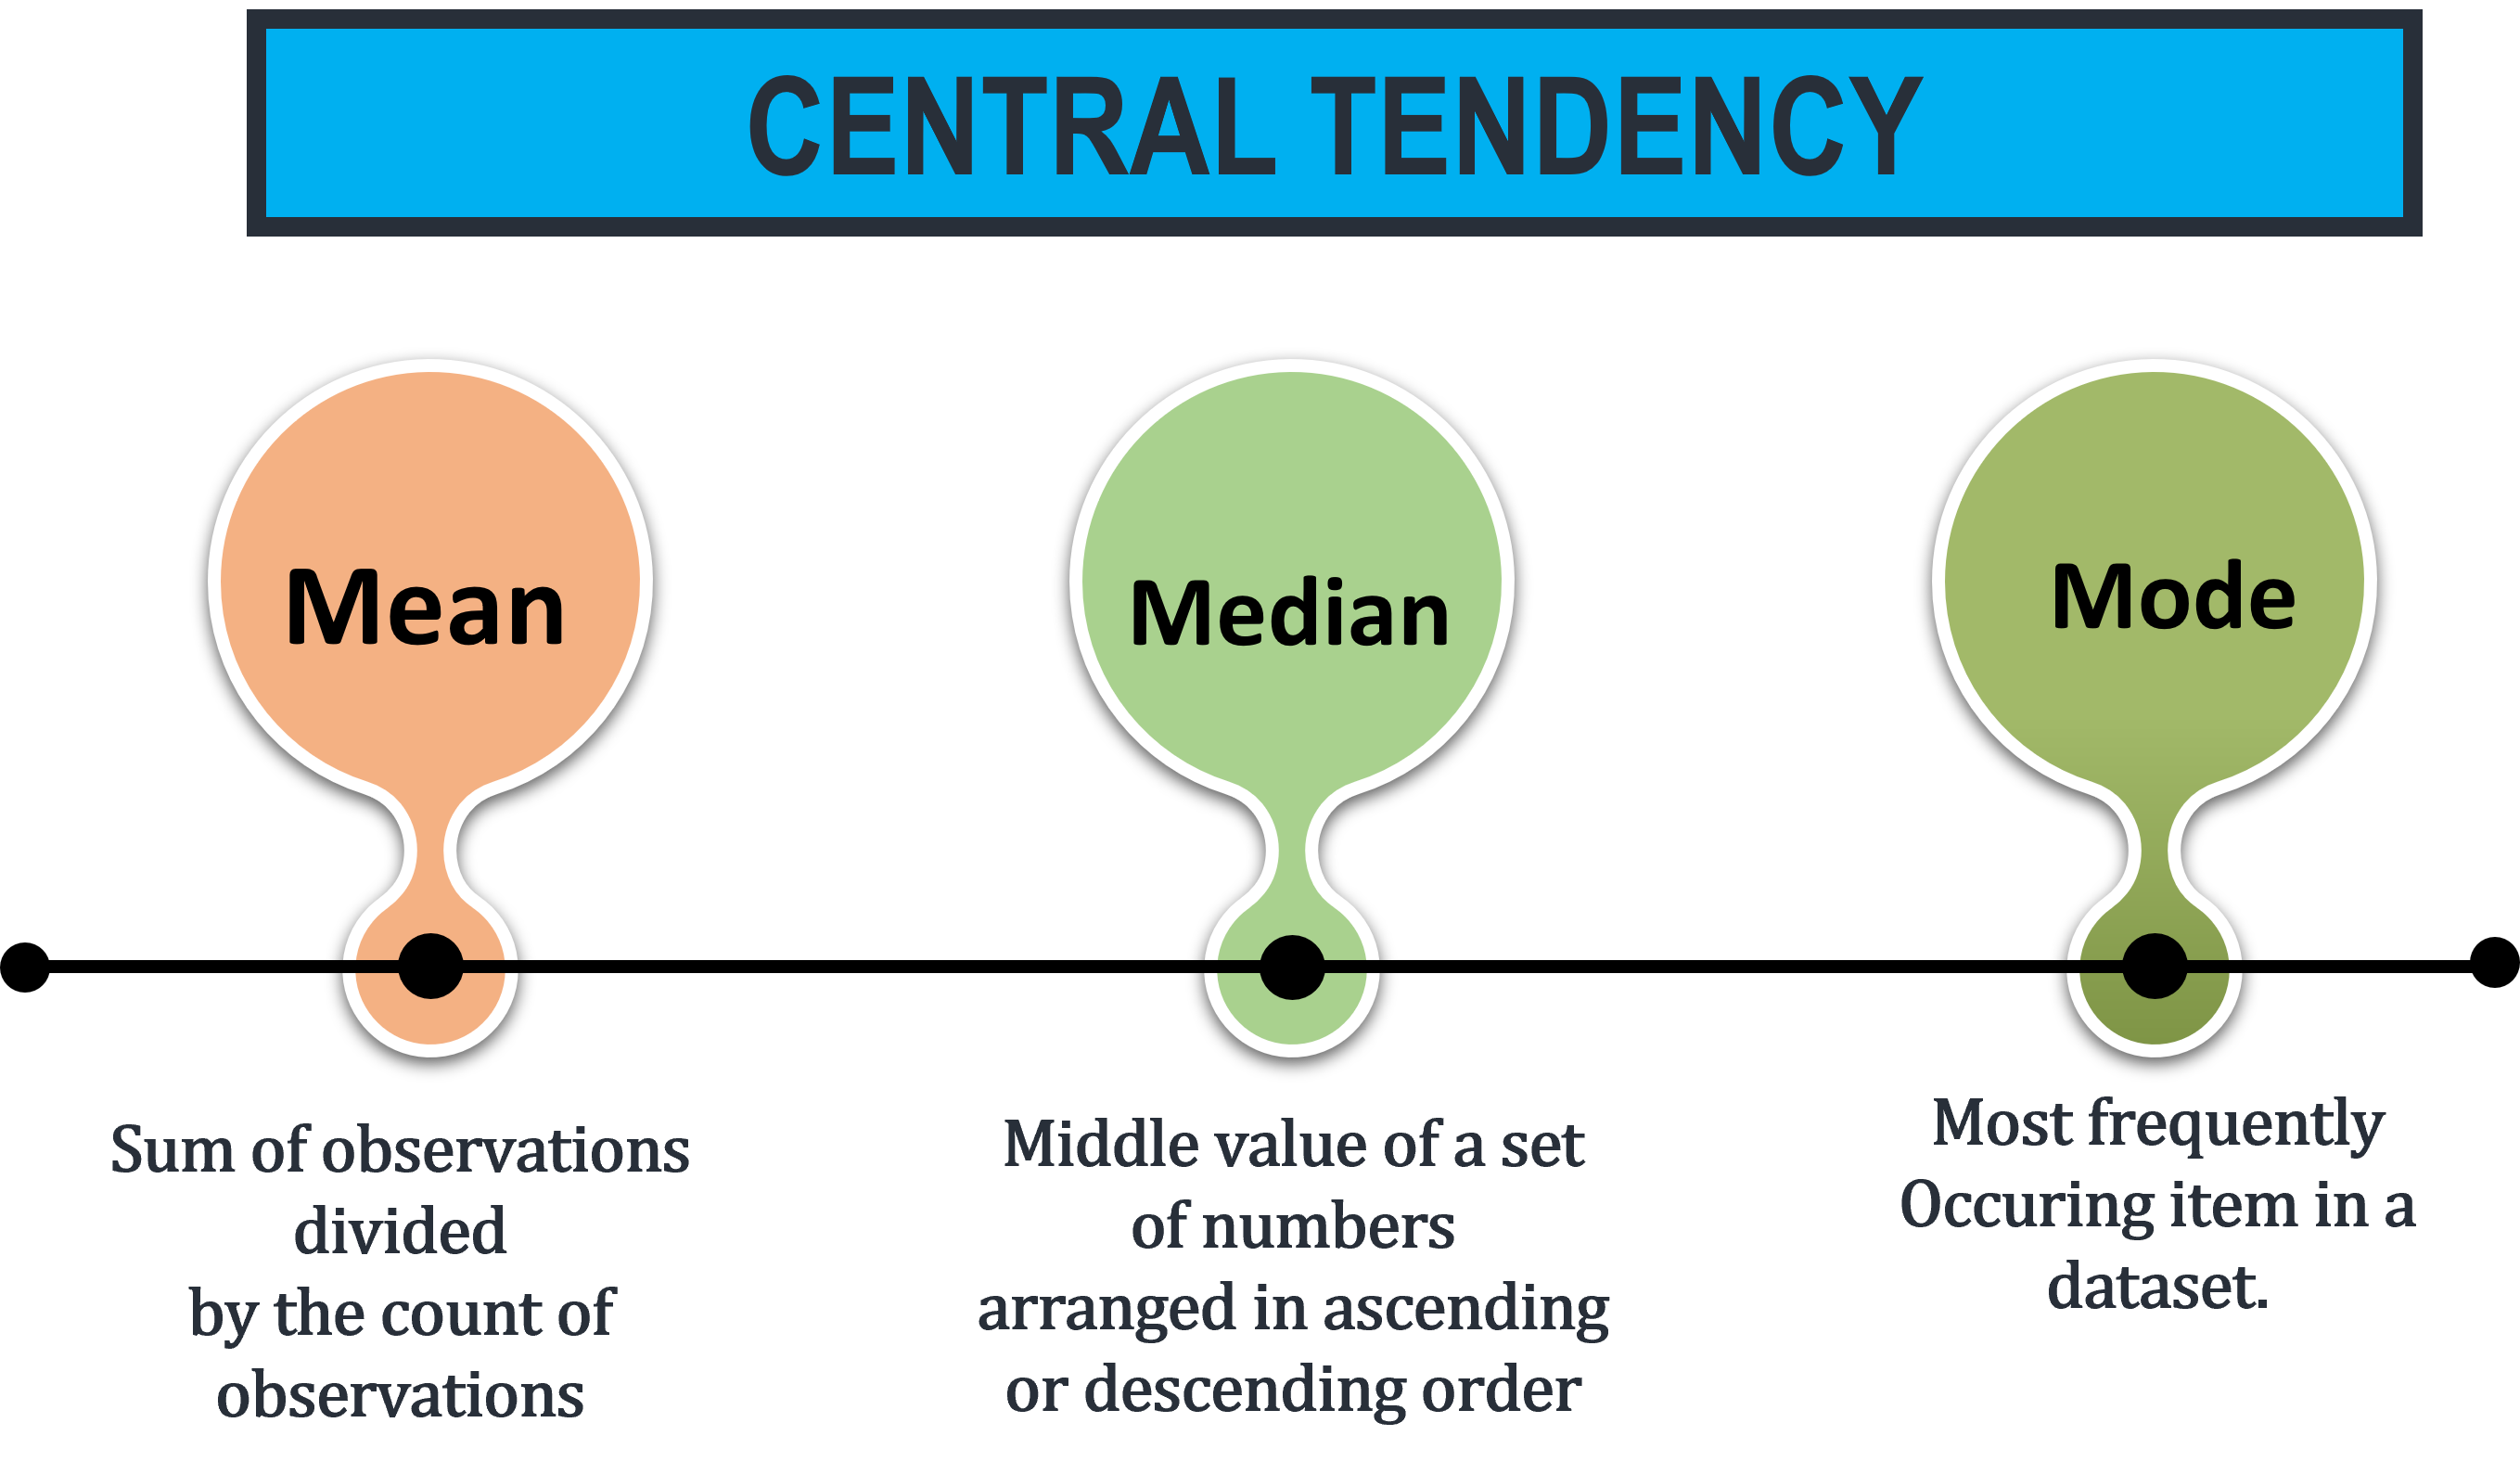
CENTRAL TENDENCY
A measure of central tendency represents mid-value or the most occurring value a large collection of numerical data. It is of significance because it depicts the nature or characteristics of the entire data.

The mean is the sum of observations divided by the count of observations.
Example: Consider the dataset: 34, 76, 98, 80, 15, 44, 54
Mean = 401/7
Mean = 57.3

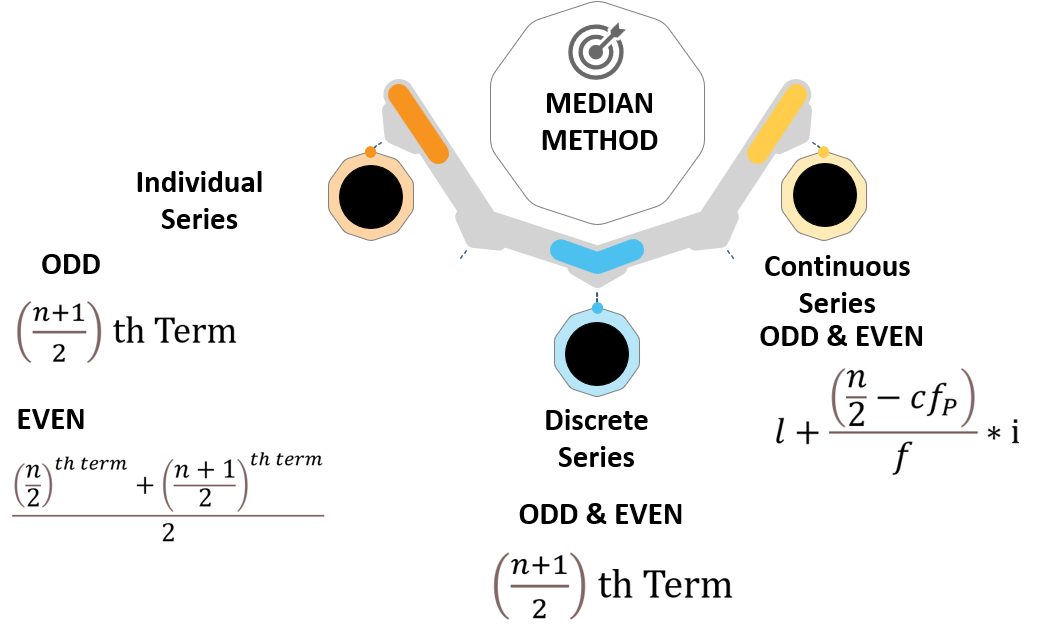
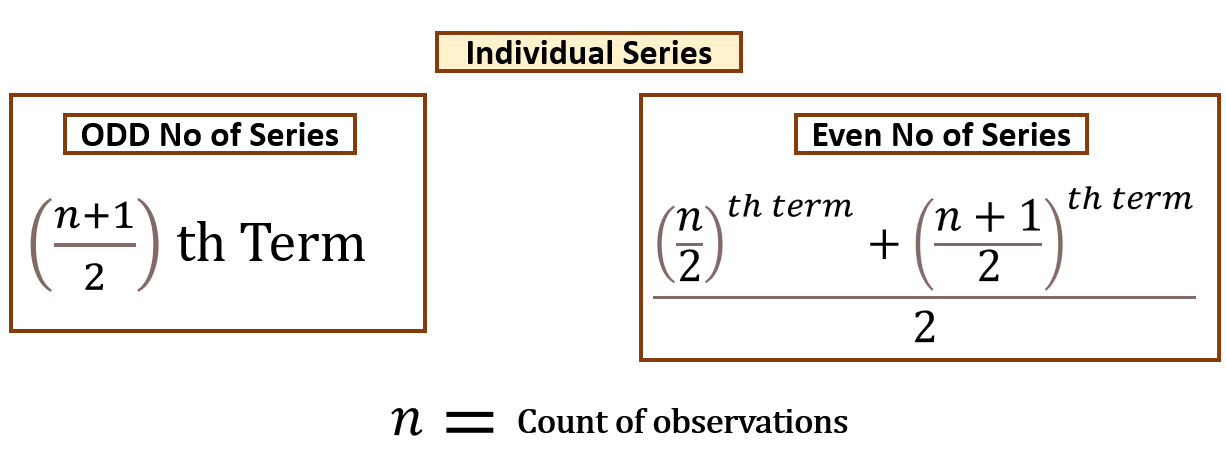
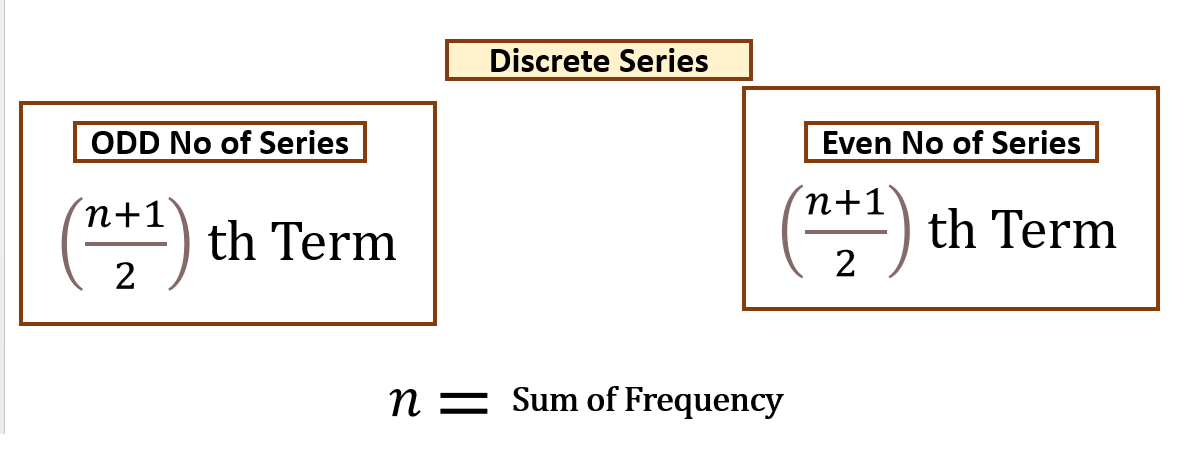
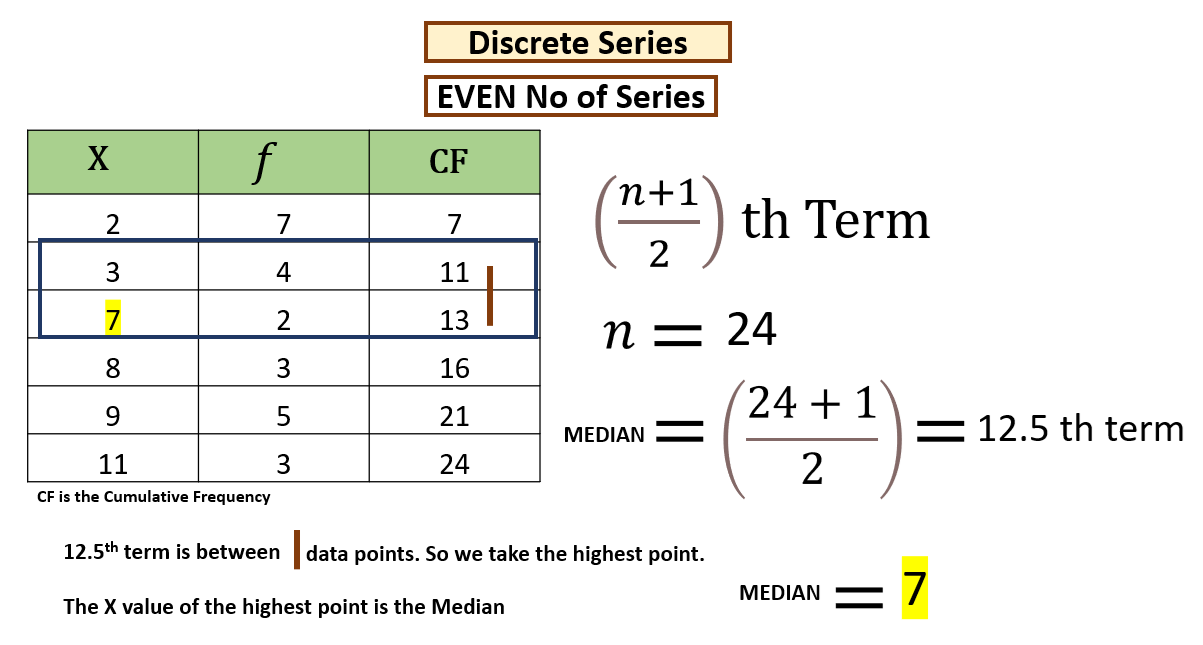
The median is the middle value of a set of numbers arranged in ascending or descending order.
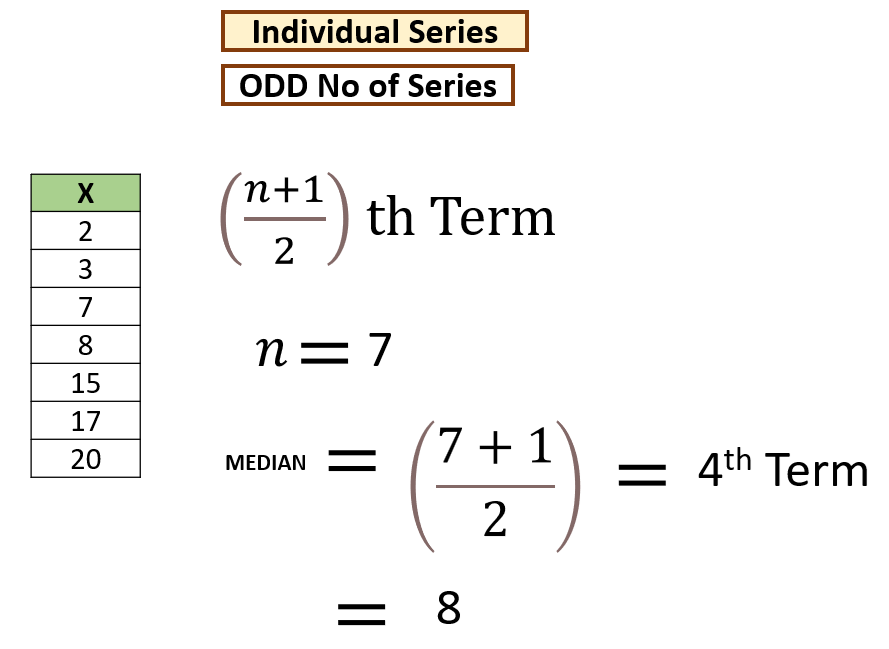
ODD NUMBER OF DATA POINTS
Example: Consider the dataset: 25, 63, 95, 85, 12, 32, 41
Solution
In the above dataset, there are 7 data points, so firstly, arrange the data points in ascending order (lowest to greatest), i.e.,
12, 25, 32, 41, 63, 85, 95
Median = ((n+1)/2)th
Median = ((7+1)/2)th
Median = 4th value
Hence, the median is 41.
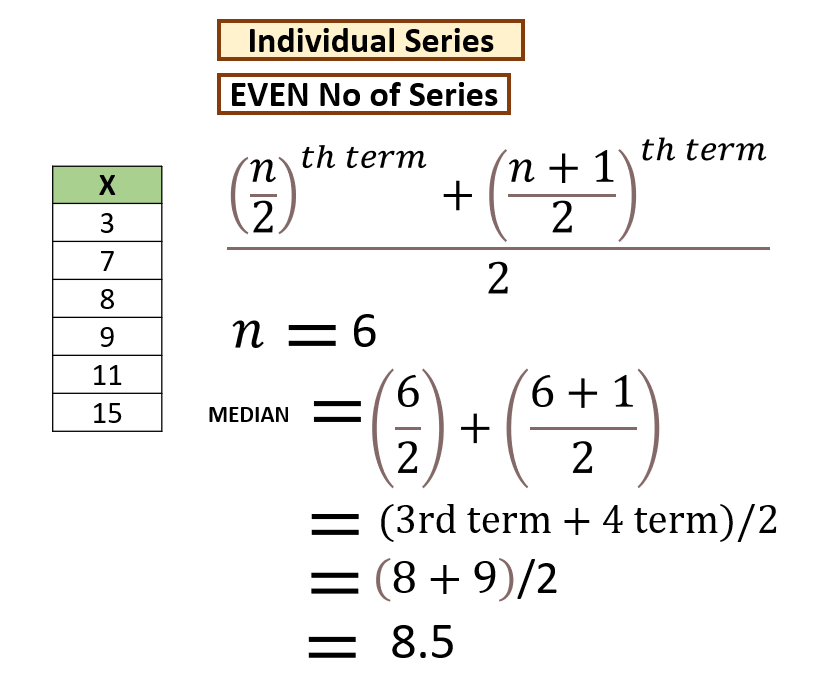
EVEN NUMBER OF DATA POINTS
Example: Consider the dataset: 27, 60, 98, 88, 18, 78
In the above dataset, there are 6 data points, so firstly, arrange the data points in ascending order (lowest to greatest), i.e.,
18, 27, 60, 78, 88, 98
Median = [(n/2)th term + ((n/2) + 1)th term] / 2
Median = [(6/2)th term + ((6/2) + 1)th term] / 2
Median = [(3th term + 4th term] / 2
Median = 98+88/2 = 93
Hence, the median is 93.

The mode is the most frequently occurring value in a dataset.
Example: Consider the dataset: 27, 60, 88, 88, 88, 78
88 is the most frequently occurring item.
Mode is 88