We want to calculate the percentage contribution of the child rows to the parent row. In our example the Department are the child rows and each has a parent which is the Gender.
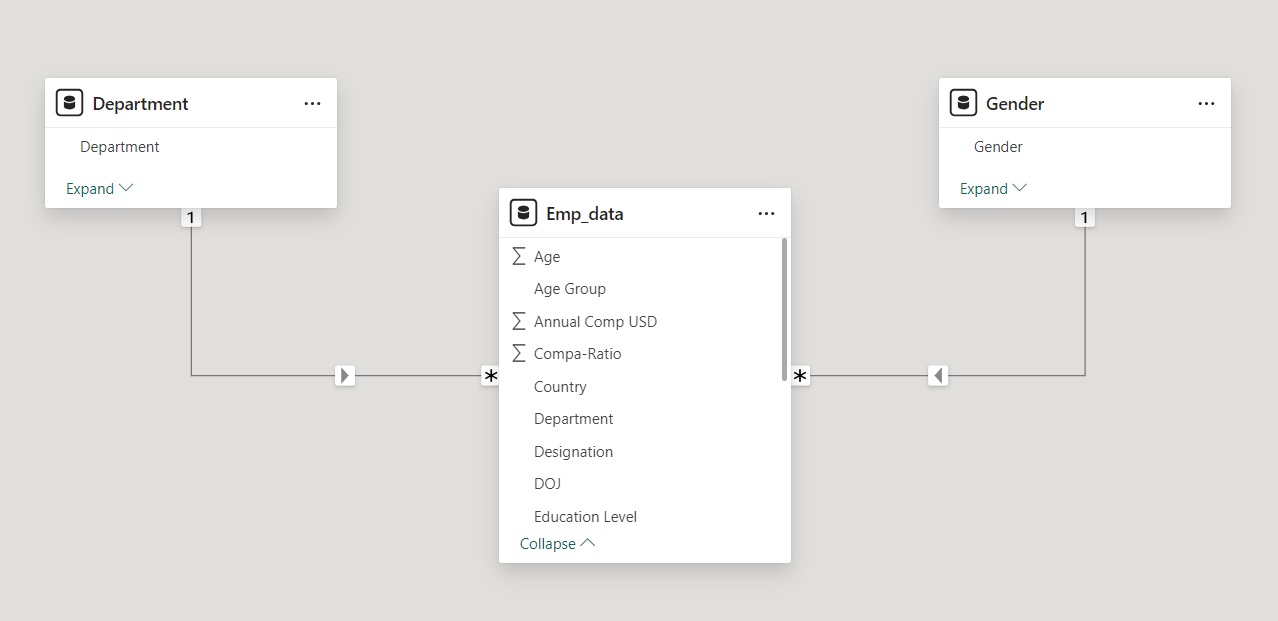
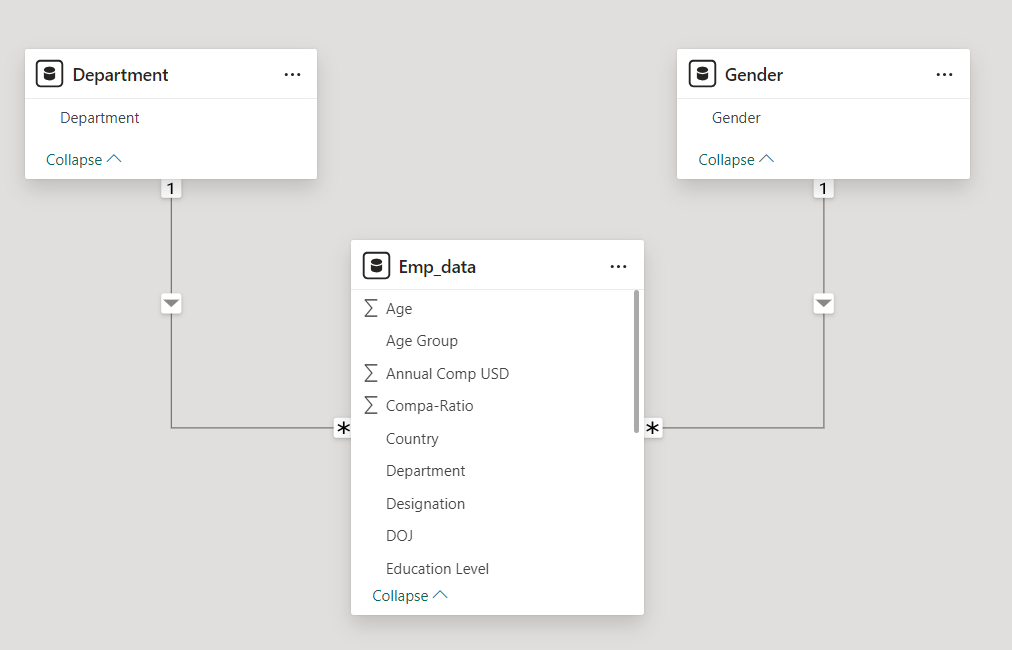
Our Data Model contains three tables Department, Gender and Emp_data.
The dimension tables are Department and Gender. The fact table is the Emp_data table.
- The Department table has a list of all the available departments in our dataset
- The Gender table has a list of all the available gender categories in our dataset.
- The Emp_data table has details for all our active employees. We have details like the department, gender, grade, designation, joining date , country and many more data.
The Department table and the Gender table are connected to our Emp_Data table in a one to many relationship.
What is Percent of PARENT Row Total
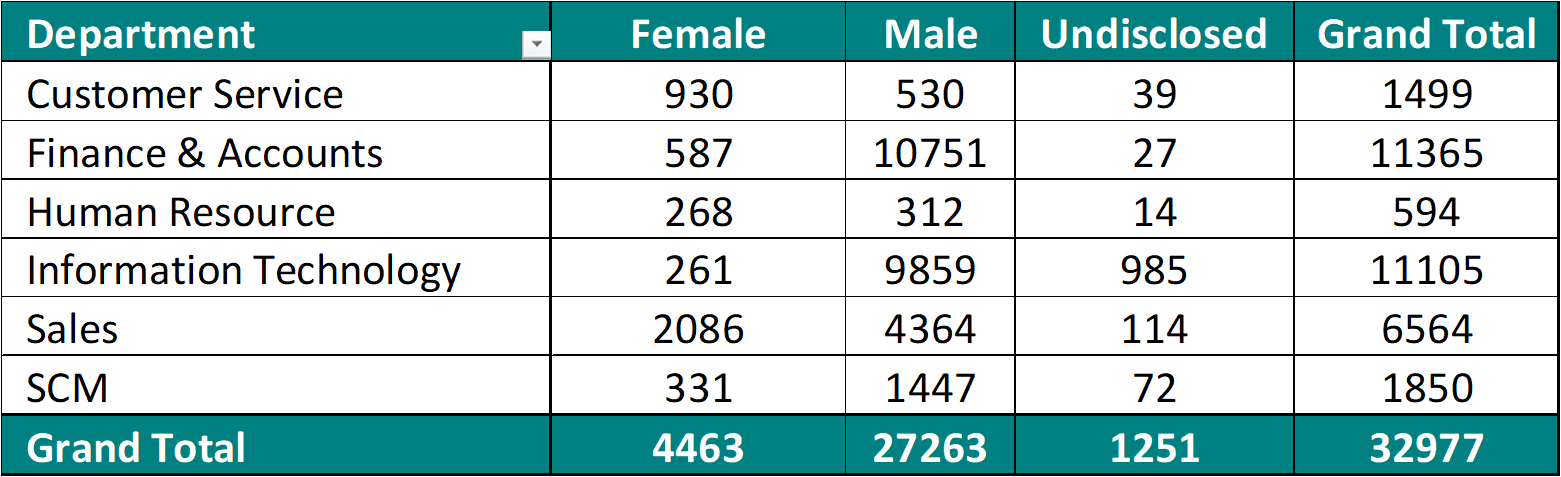
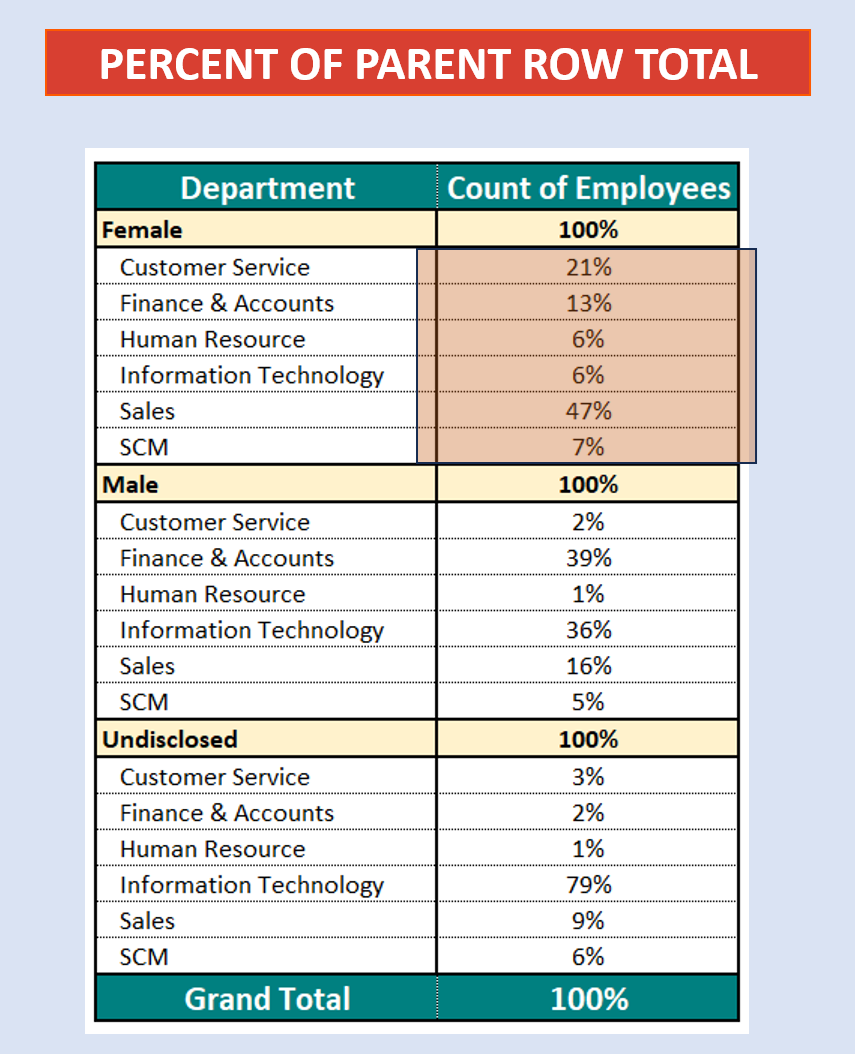
The below table gives us the count of employees by Gender across Department.

E.g Gender : Female
We have a total of 4463 female employees and the breakdown of female employees by Department
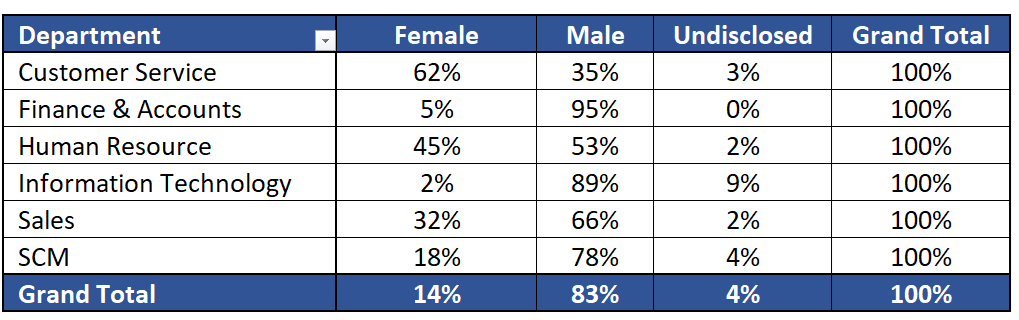
For percent of parent row total we need to find out the % values of female employees across Departments. The sum of all the values needs to be 100%
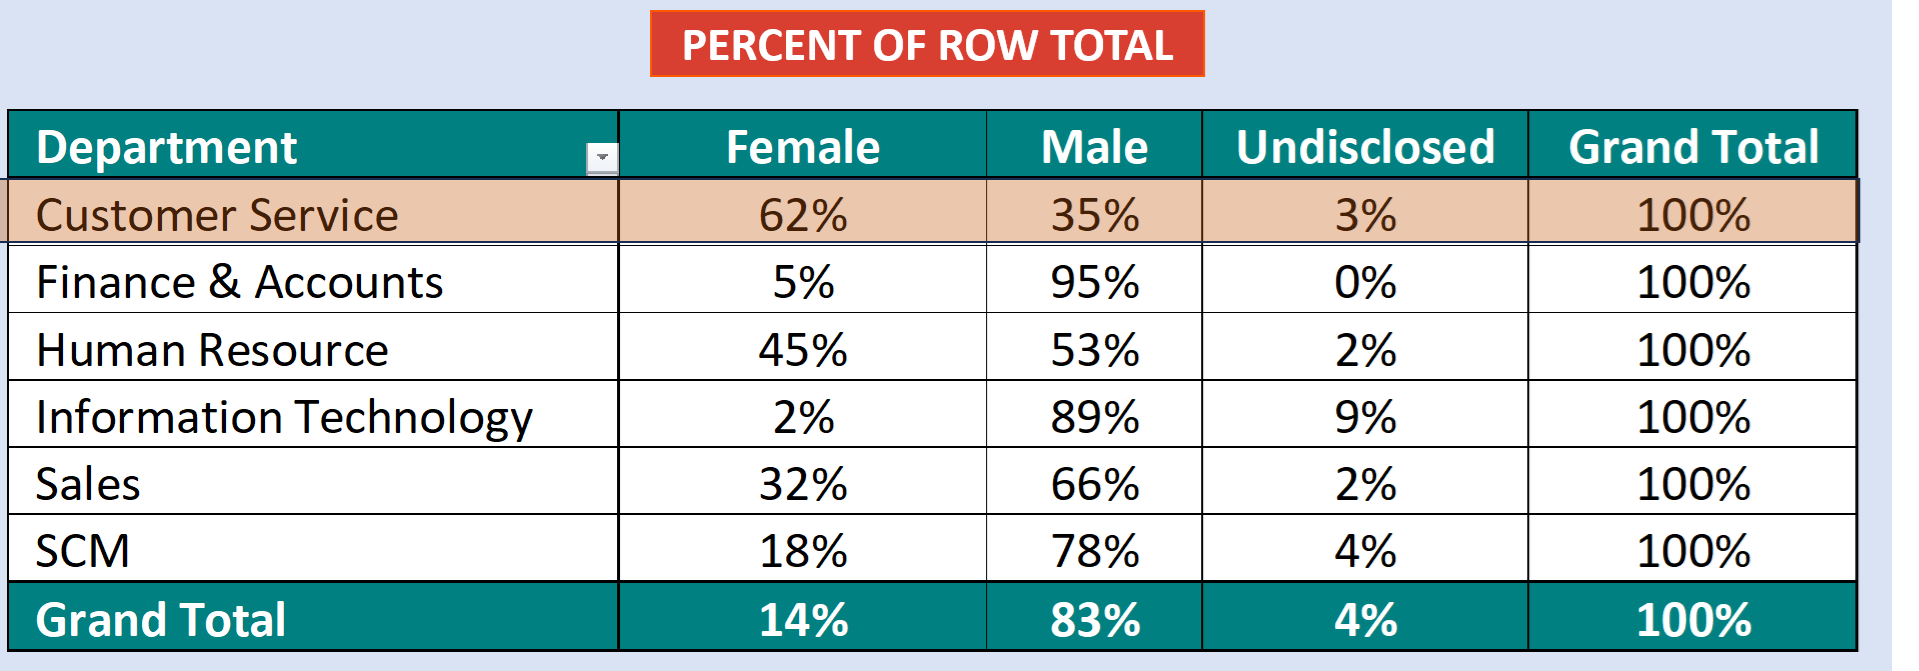
Our result must be as under:
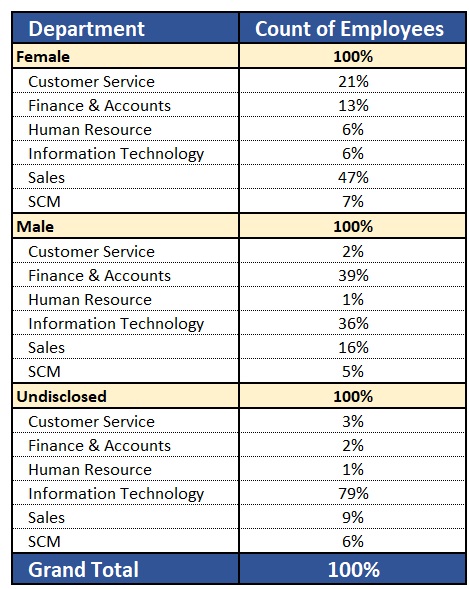
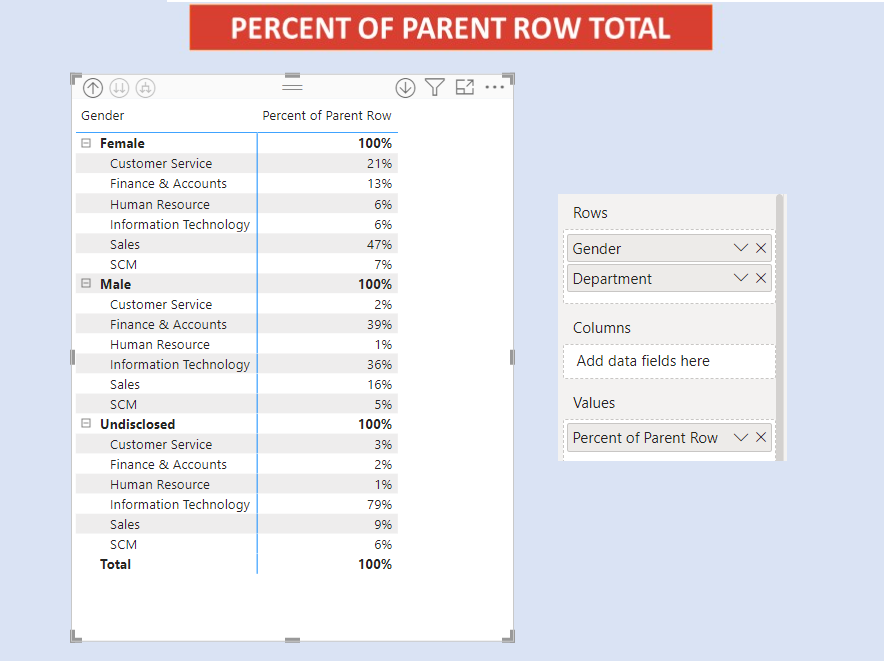
What the above tables states is that in Female Gender.
- Customer Service accounts for 21% female employees,
- Finance & Accounts accounts for 13% female employees,
- Human Resource accounts for 6% female employees and so on……….
The Total is 100% for females.
Similarly for Male employees , we get the %breakdown for male employees by Department.
And similar for Undisclosed Gender.
To achieve the below we need to calculate three measures
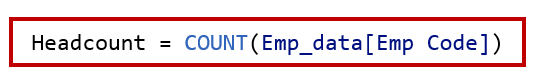
Calculate the Headcount in our dataset. Create a new measure. Name it as Headcount .
Next we need to calculate the Parent Row Total. So we will create a new measure. Name it as Row Total.
As we want the % across Gender, we need to remove the filters across the Department.
![]()
Finally, we need to calculate the Percent of Parent Row Total by dividing the headcount by the percent parent row total.
So create a new measure. Name it as Percent of Row Total. Format it as %.
![]()
Add a matrix visual to your report.
In rows add Gender (from the Gender Table). Below it in rows also add Department (from the Department Table). In values add Percent of Row Total
The resultant matrix is our percent of parent row total.
To view a video tutorial. Refer below.