We want to calculate the Top Number of Salaried employees per country. The Top Number will be basis our user selection.
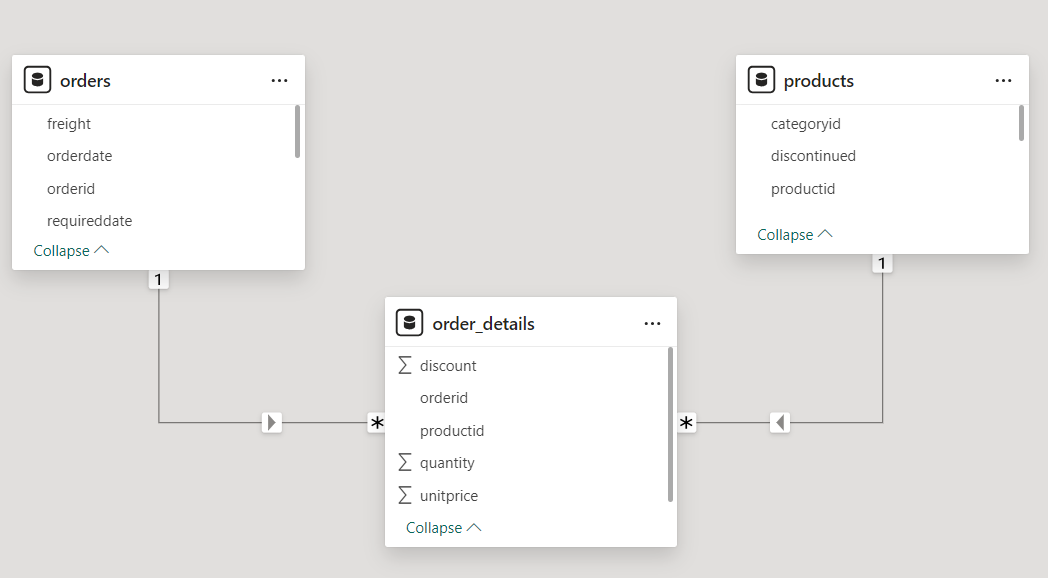
Our Data Model contains two tables Country and Emp_Data.
- The Country table has a list of all the available countries in our dataset
- The Emp_data table has details for all our active employees. We have details like the department, gender, grade, designation, joining date , country and many more data.
The dimension tables are Country. The fact table is the Emp_Data table.
The Country Table is connected to our Emp_Data table in a one to many relationship.
TOP Salaries
We want to rank the employees who have the highest salaries.
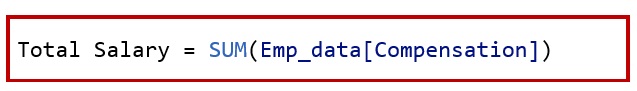
So first create a new measure and Name it as Total Salary.
To find the Top the Values, we need to specify the number we want. That is the find the Top 3 values or the Top 5 Values. So we create a Numeric Parameter. This numeric parameter will help us determine this value.
Go to Modelling – Numeric Range
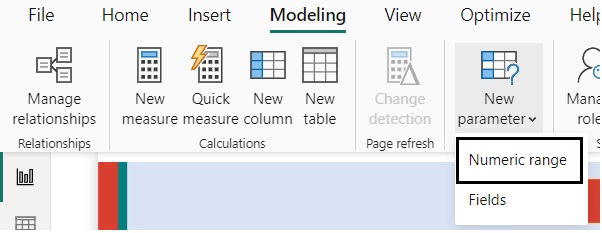
Create a parameter. Name it TopNRequired. The Minimum Value is 1 and Maximum Value is 10.
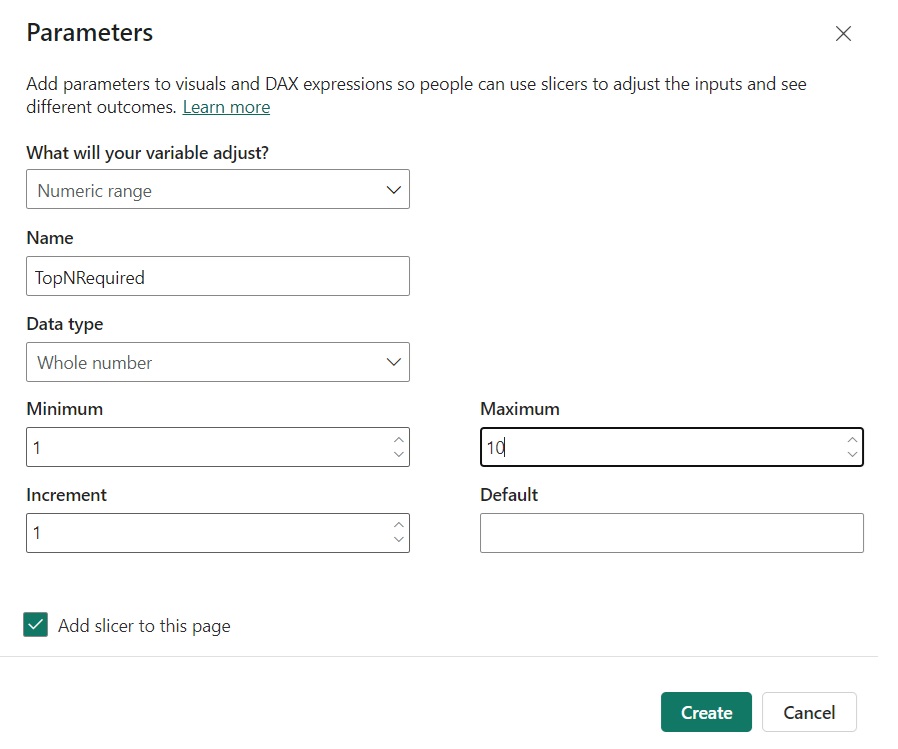
Once we create a NumericRange. We get a Slider on the Report.
To find the TopValues. We create a new measure . Name it TopSalary.
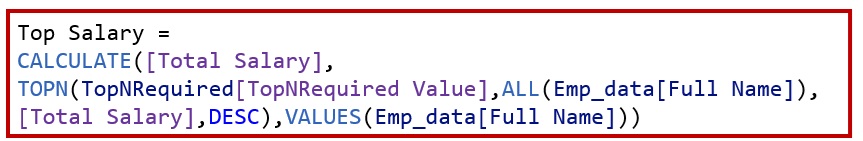
We use the numeric parameter in our TOPN function to determine how many TOPN values we require.
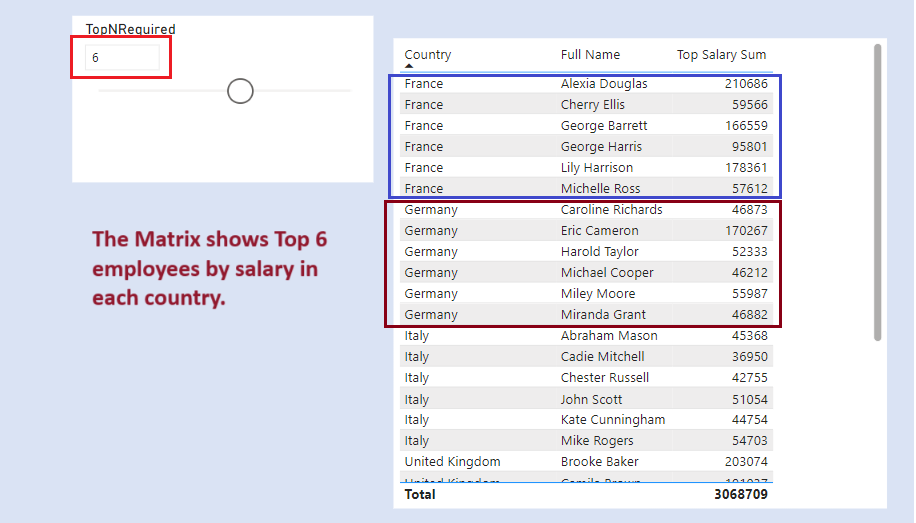
Next add the Table Visual. In Columns add Country ( from the country table), Full_Name (from the Emp_Data table) and the measures Top Salary.
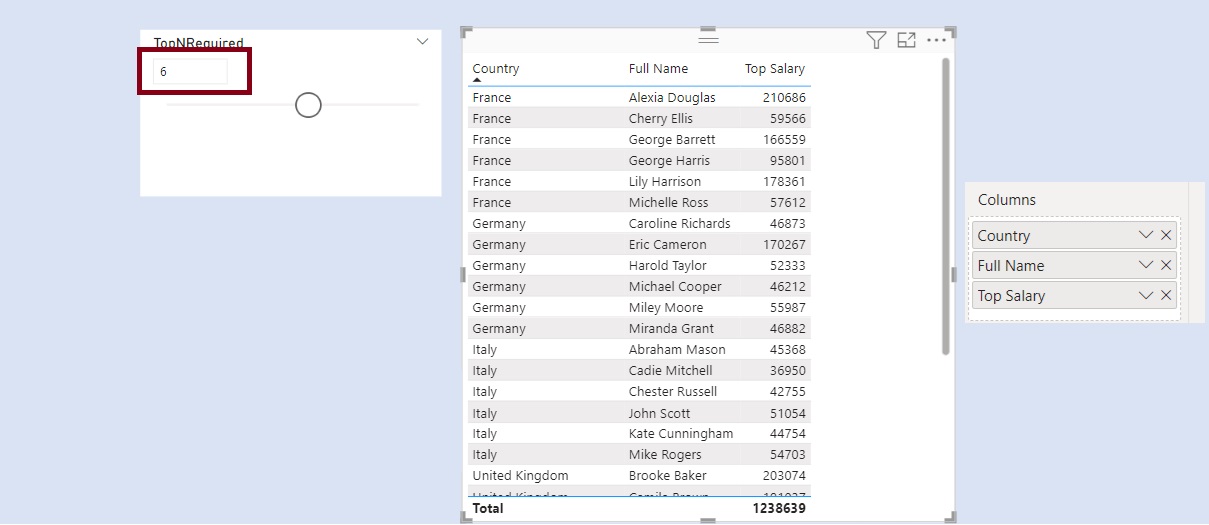
This will give us the Country , the employee names and their salary. We will get the TOPN employees by salary per Country.
So if we select 6 in the Numeric Slider. It will give the Top 6 salaried employees per country.
If you move the slider across, the number changes. And you will get the Top values as per the slider numeric parameter.
Now if you look at the grand total it is 1238639. However it is not the value you will get if you sum to above values.
This value of 1238639 is the overall Top 6 salary in our dataset (irrespective of any filters). As the Grand total is not having any filter associated with it , we get this value.
What we want is the grand total to show the sum of the above values.
To achieve this, we create a new measure. Name it as Top Salary Sum.
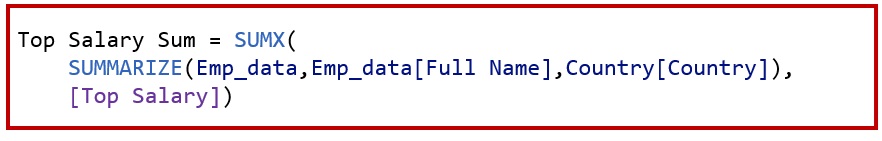
Now add this measure to our Table visual.
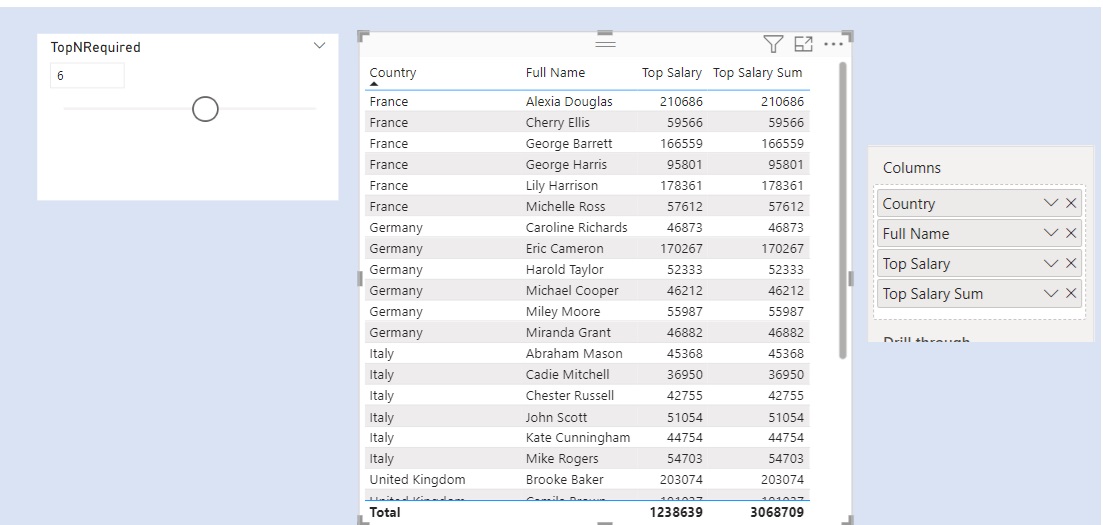
If you look at the Grand Total , it will give us the sum of the above values.
The Top Salary and the Top Salary Sum measure gives the same value for all the rows. Except on the Grand Total.
- The Top Salary gives the overall Top 6 Salary.
- Whereas the Top Salary Sum gives us the sum of the top 6 salary values as the Grand Total
To view a Video Tutorial, Refer Below: